Answered step by step
Verified Expert Solution
Link Copied!

Question

1 Approved Answer

Help me understand the following. Calculations and Comparisons of Annual GDP Growth Rates US Presidential Administrations (first full year in office to final full year

Help me understand the following.

Calculations and Comparisons of Annual GDP Growth Rates

US Presidential Administrations

(first full year in office to final full year in office)

Presidential Administration

Term of Office

Real GDP Growth Rate

Eisenhower

1953-1960

(Fill in the blank)Real GDP Growth Rate

Kennedy/Johnson

1961-1968

(Fill in the blank)Real GDP Growth Rate

Nixon/Ford

1969-1976

(Fill in the blank)Real GDP Growth Rate

Carter

1977-1980

(Fill in the blank)Real GDP Growth Rate

Reagan/Bush (I)

1981-1992

(Fill in the blank)Real GDP Growth Rate

Clinton

1993-2000

(Fill in the blank)Real GDP Growth Rate

Bush (II)

2001-2008

(Fill in the blank)Real GDP Growth Rate

Obama

2009-2016

(Fill in the blank)Real GDP Growth Rate
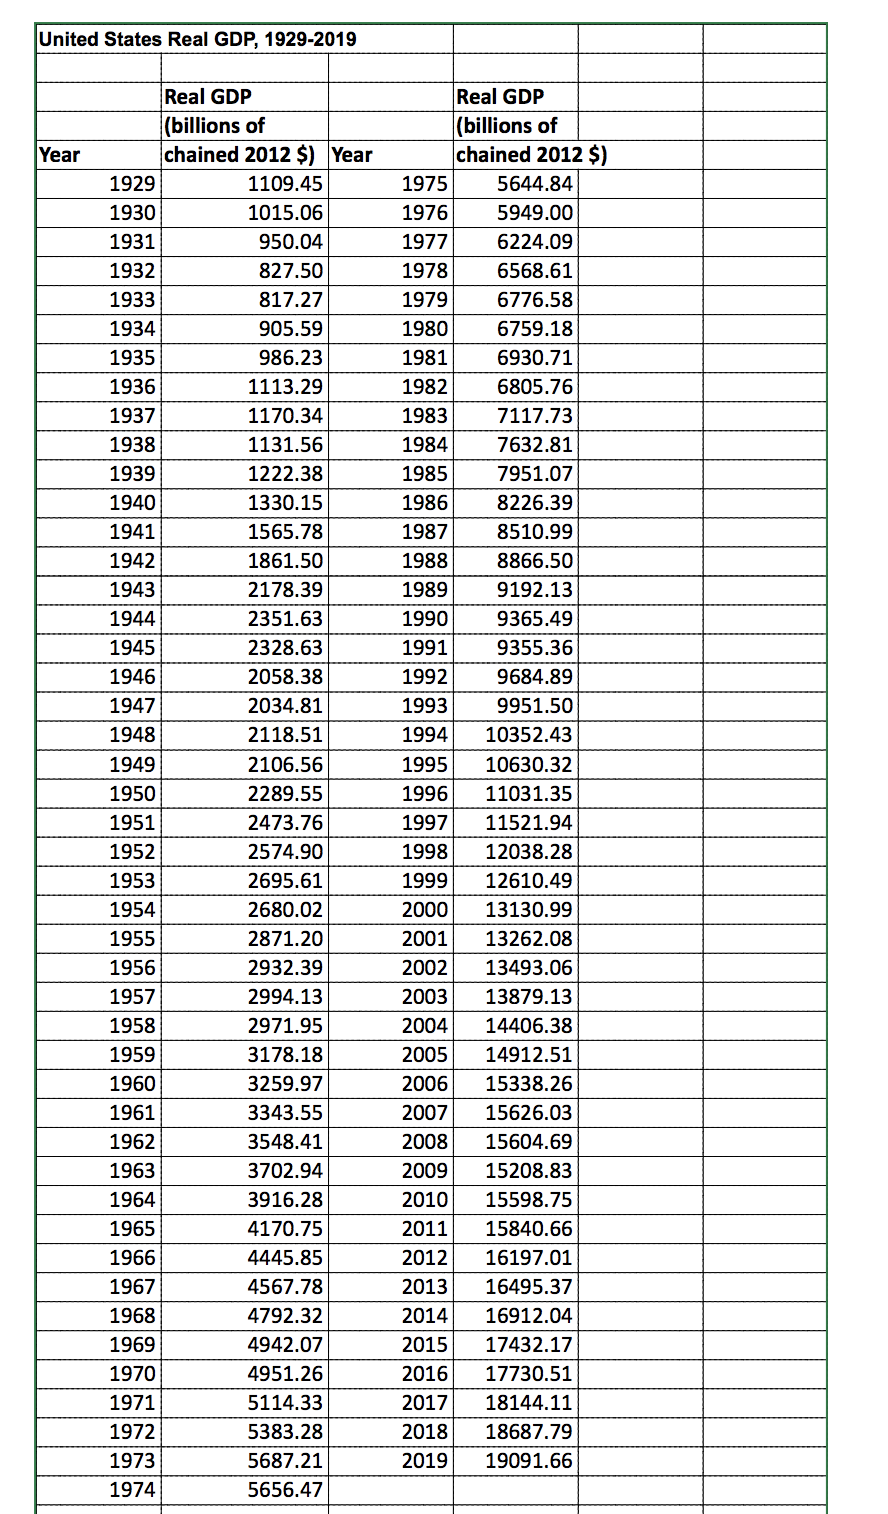
image text in transcribed
United States Real GDP, 1929-2019 Real GDP Real GDP (billions of (billions of Year chained 2012 $) Year chained 2012 $) 1929 1109.45 1975 5644.84 1930 1015.06 1976 5949.00 1931 950.04 1977 6224.09 1932 827.50 1978 6568.61 1933 817.27 1979 6776.58 1934 905.59 1980 6759.18 1935 986.23 1981 6930.71 1936 1113.29 1982 6805.76 1937 1170.34 1983 7117.73 1938 1131.56 1984 7632.81 1939 1222.38 1985 7951.07 1940 1330.15 1986 8226.39 1941 1565.78 1987 8510.99 1942 1861.50 1988 8866.50 1943 2178.39 1989 9192.13 1944 2351.63 1990 9365.49 1945 2328.63 1991 9355.36 1946 2058.38 1992 9684.89 1947 2034.81 1993 9951.50 1948 2118.51 1994 10352.43 1949 2106.56 1995 10630.32 1950 2289.55 1996 11031.35 1951 2473.76 1997 11521.94 1952 2574.90 1998 12038.28 1953 2695.61 1999 12610.49 1954 2680.02 2000 13130.99 1955 2871.20 2001 13262.08 1956 2932.39 2002 13493.06 1957 2994.13 2003 13879.13 1958 2971.95 2004 14406.38 1959 3178.18 2005 14912.51 1960 3259.97 2006 15338.26 1961 3343.55 2007 15626.03 1962 3548.41 2008 15604.69 1963 3702.94 2009 15208.83 1964 3916.28 2010 15598.75 1965 4170.75 2011 15840.66 1966 4445.85 2012 16197.01 1967 4567.78 2013 16495.37 1968 4792.32 2014 16912.04 1969 4942.07 2015 17432.17 1970 4951.26 2016 17730.51 1971 5114.33 2017 18144.11 1972 5383.28 2018 18687.79 1973 5687.21 2019 19091.66 1974 5656.47

Step by Step Solution

There are 3 Steps involved in it

Step: 1

blur-text-image

Get Instant Access to Expert-Tailored Solutions

See step-by-step solutions with expert insights and AI powered tools for academic success

Step: 2

blur-text-image

Step: 3

blur-text-image

Ace Your Homework with AI

Get the answers you need in no time with our AI-driven, step-by-step assistance

Get Started

Recommended Textbook for

Intermediate Microeconomics and Its Application

Authors: walter nicholson, christopher snyder

11th edition

9781111784300, 324599102, 1111784302, 978-0324599107

More Books

Students also viewed these Economics questions

Question

=+ d. What happens to Oceanias trade balance?

Answered: 1 week ago

Question

=+ e. What happens to Oceanias real exchange rate?

Answered: 1 week ago