Answered step by step
Verified Expert Solution
Link Copied!

Question

1 Approved Answer

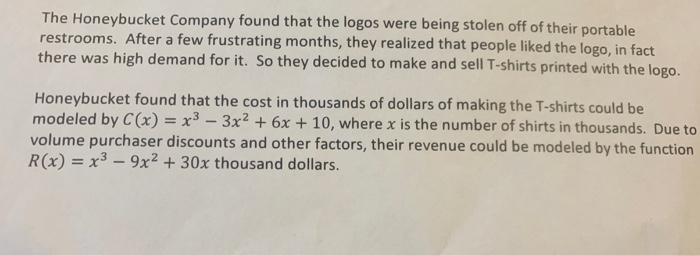
help me with the excel 1 to 6 1. Graph the revenue and cost functions on the same Excel graph using the domain [0,4] and

help me with the excel 1 to 6 image text in transcribed
image text in transcribed
1. Graph the revenue and cost functions on the same Excel graph using the domain [0,4] and the range [0, 50]. Be sure to label your axes completely and clearly and use the legend to label the two graphs. See the box below for formatting pages with graphs. 2. Using two rulers or straight edges as movable tangent lines, examine your graphs to see where marginal cost matches marginal revenue. At what value of x does this appear to occur? 3. Now using the algebraic derivatives of these functions, calculate where this point actually occurs to the nearest tenth. You may use technology to help you, but explain how you used it in enough detail for a classmate to be able to reproduce your results. 4. Find the equation for each tangent line by hand using the points obtained in part B3. Reprint your graph from part 1 but with gridlines this time and include the graphs of the tangent line(s) with a domain interval one to two units long, To do this, put the equation of C each line into a column. Highlight Column A and the columns where you have the formulas for the functions you want to graph, then create the chart. Label each tangent line with its equation. 5. Make a table of values: from your graph, using eyeball estimates, write down the vertical distance between R(x) and C(x) for at least 5 x -values in the domain you used for your tangent line - including the x -value you got in B3. Comment on the results. 6. Graph the profit function over the same domain. Look at the points where the profit graph crosses the x-axis. What is happening at these same x-values on the Revenue and Cost graph? The Honeybucket Company found that the logos were being stolen off of their portable restrooms. After a few frustrating months, they realized that people liked the logo, in fact there was high demand for it. So they decided to make and sell T-shirts printed with the logo. Honeybucket found that the cost in thousands of dollars of making the T-shirts could be modeled by C(x) = x3 - 3x2 +6x + 10, where x is the number of shirts in thousands. Due to volume purchaser discounts and other factors, their revenue could be modeled by the function R(x) = x3 - 9x2 + 30x thousand dollars

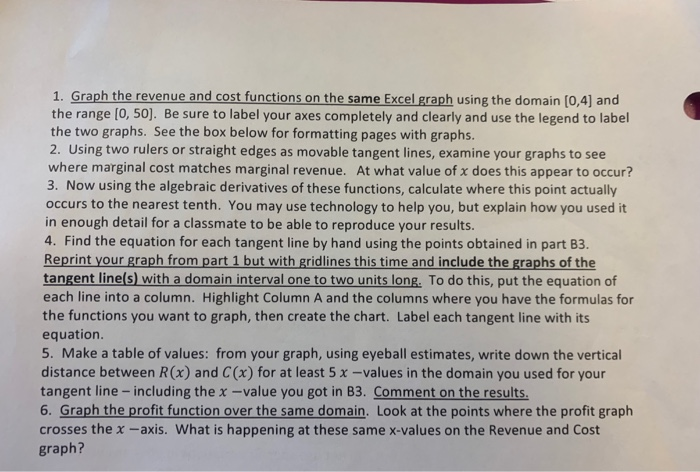
Step by Step Solution

There are 3 Steps involved in it

Step: 1

blur-text-image

Get Instant Access to Expert-Tailored Solutions

See step-by-step solutions with expert insights and AI powered tools for academic success

Step: 2

blur-text-image

Step: 3

blur-text-image

Ace Your Homework with AI

Get the answers you need in no time with our AI-driven, step-by-step assistance

Get Started

Recommended Textbook for

More Books

Students also viewed these Accounting questions

Question

How much can an individual transfer, gift tax-free, each year?

Answered: 1 week ago