Help me with the following 10 questions! Only answer if you know the answers for sure 1). This table lists the yearly cost of tuition
Help me with the following 10 questions! Only answer if you know the answers for sure
1).
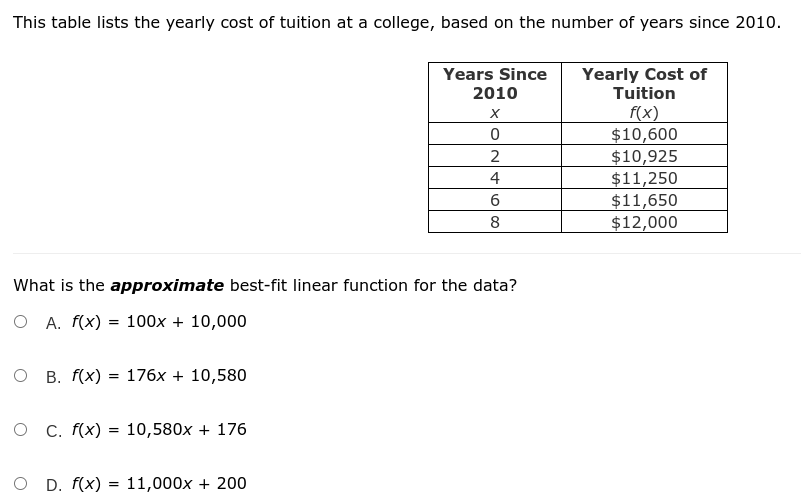
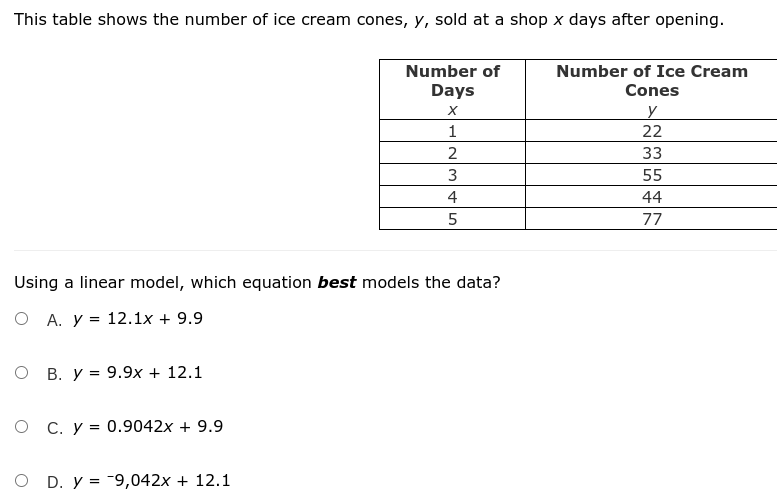
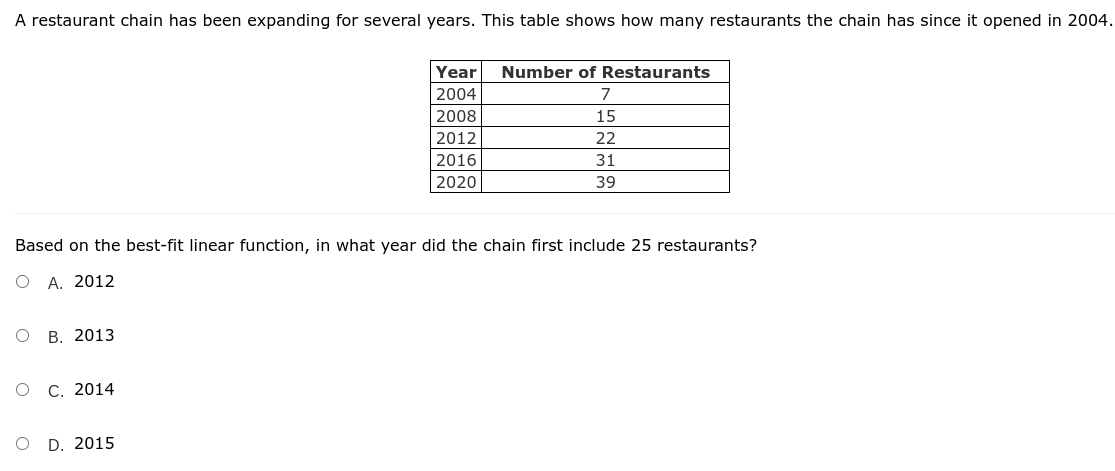
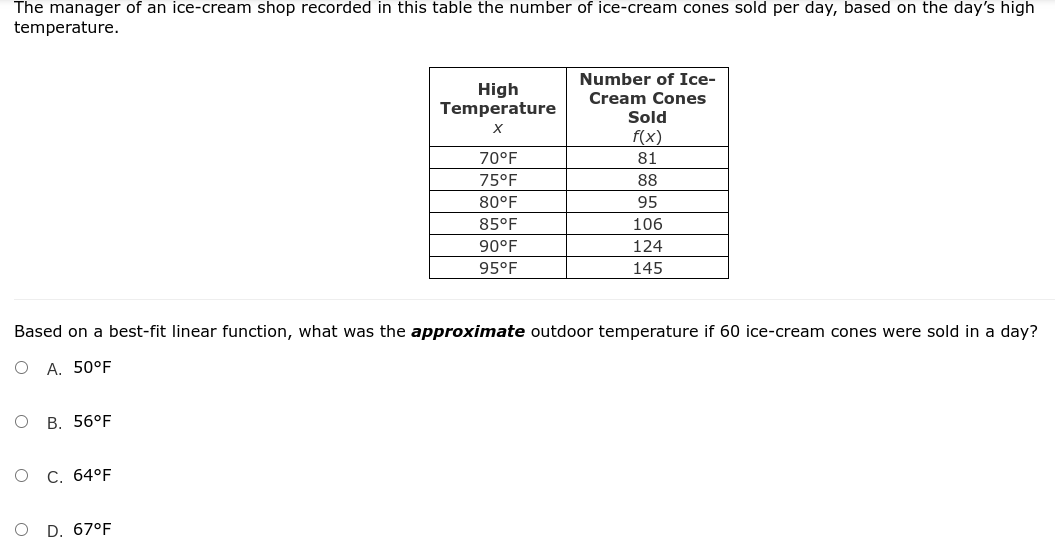
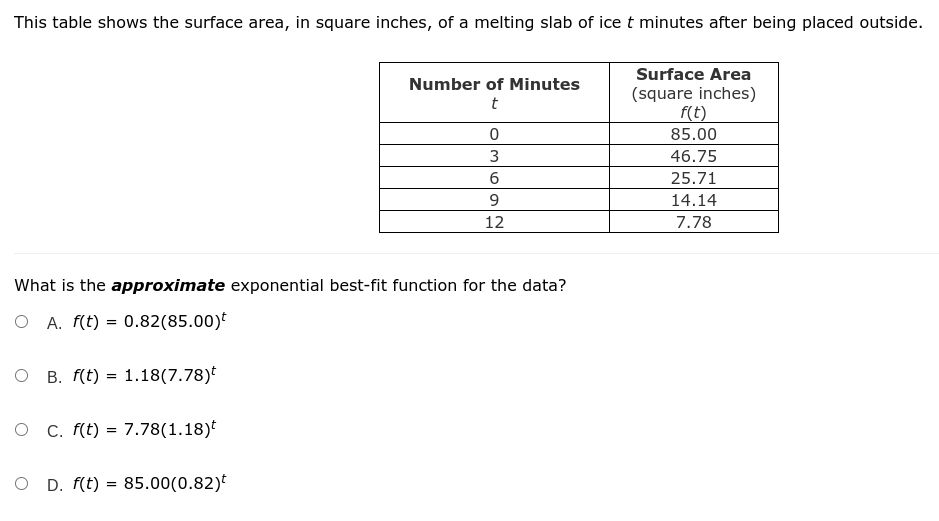
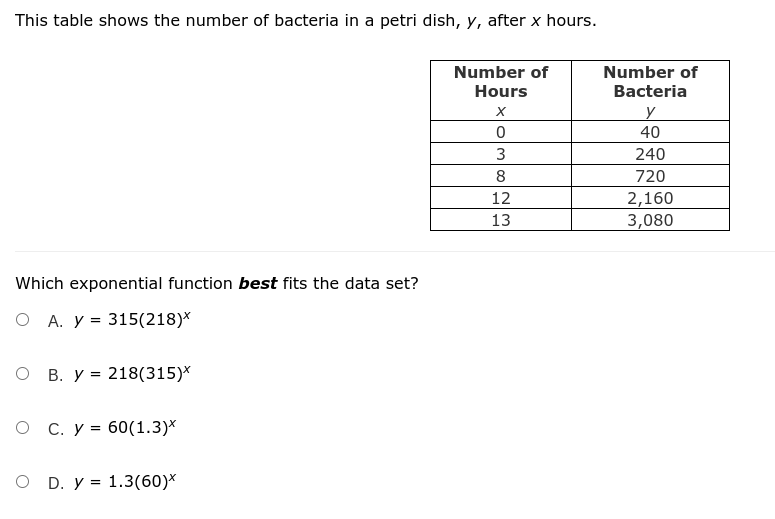
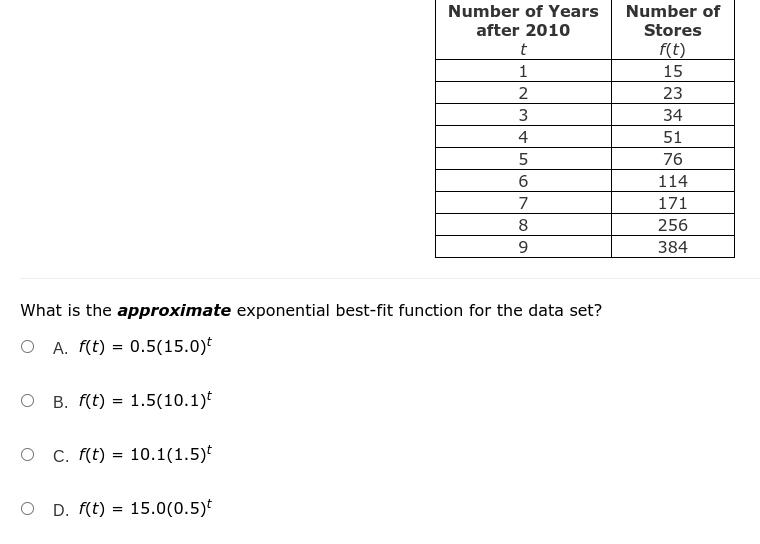
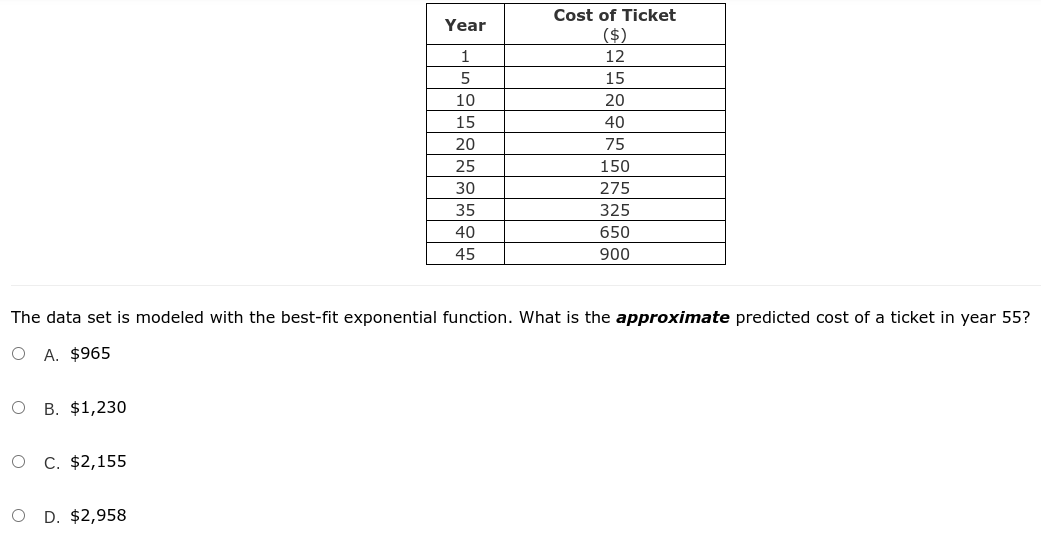
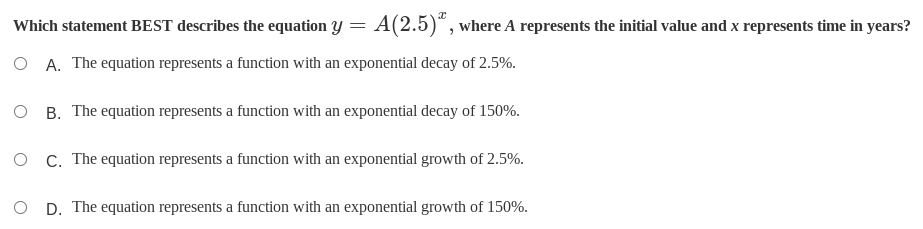
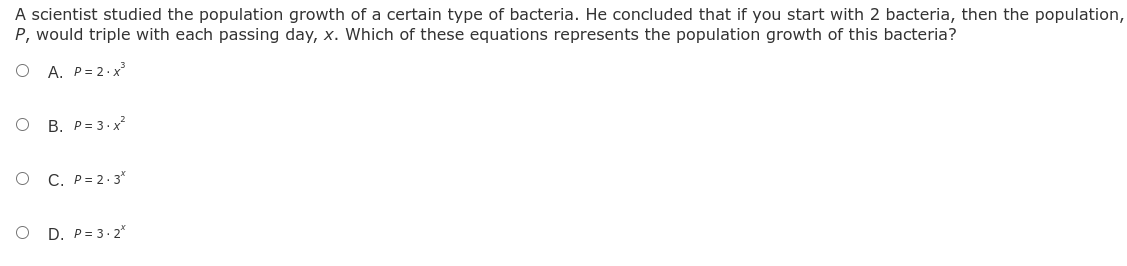
This table lists the yearly cost of tuition at a college, based on the number of years since 2010. Years Since Yearly Cost of 2010 Tuition X f(x ) 0 $10,600 2 $10,925 4 $11,250 6 $11,650 8 $12,000 What is the approximate best-fit linear function for the data? O A. f(x) = 100x + 10,000 O B. f(x) = 176x + 10,580 O c. f(x) = 10,580x + 176 O D. f(x) = 11,000x + 200This table shows the number of ice cream cones, y, sold at a shop x days after opening. Number of Number of Ice Cream Day's Cones l" 22 33 55 44 :r'? Using a linear model, which equation best models the data? 0 A. if: 12.1x+ 9.9 O B. Y = 9.9X+ 12.1 D C. y = H.9042X + 9.9 O D. Y = '9,D42X+ 12.1 A restaurant chain has been expanding for several years. This table shows how many restaurants the chain has since it opened in 2004. Year Number of Restaurants 2004 7 2008 15 2012 22 2015 31 2020 39 Based on the best-t linear function, in what year did the chain rst include 25 restaurants? 0 A_ 2012 O B_ 2013 O C. 2014 O D_ 2015 The manager of an ice-cream shop recorded in this table the number of ice-cream cones sold per day, based on the day's high temperature. High Number of Ice- Temperature Cream Cones Sold X f(x) 81 750F 88 80 F 95 106 90 F 124 950F 145 Based on a best-fit linear function, what was the approximate outdoor temperature if 60 ice-cream cones were sold in a day? O A. 50 F O B. 56 F O C. 64OF O D. 67 FThis table shows the surface area, in square inches, of a melting slab of ice t minutes after being placed outside. Number of Minutes Surface Area t (square inches) f(t) 0 85.00 3 46.75 6 25.71 9 14.14 12 7.78 What is the approximate exponential best-fit function for the data? O A. f(t) = 0.82(85.00)t O B. f(t) = 1.18(7.78)t O c. f(t) = 7.78(1.18)t O D. f(t) = 85.00(0.82)This table shows the number of bacteria in a petri dish, y, after x hours. Number of Number of Hours Bacteria X y 0 40 3 240 8 720 12 2,160 13 3,080 Which exponential function best fits the data set? O A. y = 315(218)* O B. y = 218(315)* O C. y = 60(1.3)* O D. y = 1.3(60)*Number of Years Number of after 201!) Stores t t} 256 . 384 What is the approximate exponential best-t function for the data set? D O A. t] = 115(1513}t a. t] = 1.5{1111}.t c. t] = 1I:I.1{1_5}t D. t] = 15:21:93.5}t Cost of Ticket Year (3;) 1 12 5 15 20 The data set is modeled with the best-fit exponential function. What is the approximate predicted cost of a ticket in year 55? O A. $955 0 B. $1,230 0 C. $2,155 0 D. $2,958 Which statement BEST describes the equation y = A(2.5)", where A represents the initial value and x represents time in years? O A. The equation represents a function with an exponential decay of 2.5%. O B. The equation represents a function with an exponential decay of 150%. O C. The equation represents a function with an exponential growth of 2.5%. O D. The equation represents a function with an exponential growth of 150%.A scientist studied the population growth of a certain type of bacteria. He concluded that if you start with 2 bacteria, then the population, P, would triple with each passing day, X. Which of these equations represents the population growth of this bacteria? 0 A. P=21x3 O B. 9:31):2 O C. 13:213' 0 [)_ 13:312'
Step by Step Solution
There are 3 Steps involved in it
Step: 1
Get Instant Access to Expert-Tailored Solutions
See step-by-step solutions with expert insights and AI powered tools for academic success
Step: 2
Step: 3
Ace Your Homework with AI
Get the answers you need in no time with our AI-driven, step-by-step assistance