

Answered step by step
Verified Expert Solution
Question
1 Approved Answer
Help needed for Questions 4- 7. Thank You. The data used for this assignment comes again from the txhousing data in the ggplot2 package, which
Help needed for Questions 4- 7. Thank You.
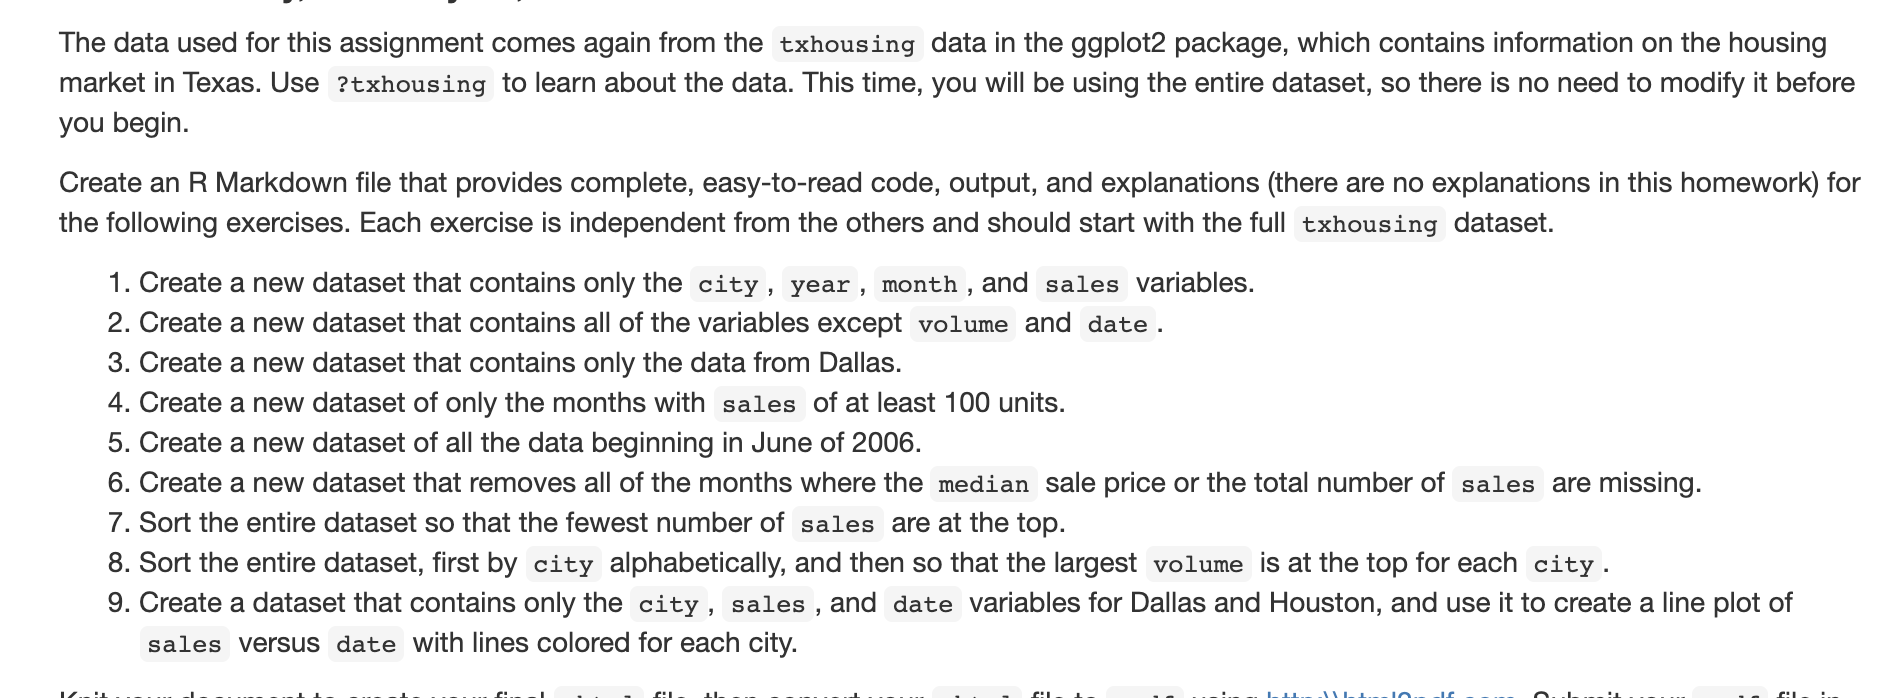
The data used for this assignment comes again from the txhousing data in the ggplot2 package, which contains information on the housing market in Texas. Use ?txhousing to learn about the data. This time, you will be using the entire dataset, so there is no need to modify it before you begin. Create an R Markdown file that provides complete, easy-to-read code, output, and explanations (there are no explanations in this homework) for the following exercises. Each exercise is independent from the others and should start with the full txhousing dataset. 1. Create a new dataset that contains only the city, year, month , and sales variables. 2. Create a new dataset that contains all of the variables except volume and date. 3. Create a new dataset that contains only the data from Dallas. 4. Create a new dataset of only the months with sales of at least 100 units. 5. Create a new dataset of all the data beginning in June of 2006. 6. Create a new dataset that removes all of the months where the median sale price or the total number of sales are missing. 7. Sort the entire dataset so that the fewest number of sales are at the top. 8. Sort the entire dataset, first by city alphabetically, and then so that the largest volume is at the top for each city. 9. Create a dataset that contains only the city , sales , and date variables for Dallas and Houston, and use it to create a line plot of sales versus date with lines colored for each city. The data used for this assignment comes again from the txhousing data in the ggplot2 package, which contains information on the housing market in Texas. Use ?txhousing to learn about the data. This time, you will be using the entire dataset, so there is no need to modify it before you begin. Create an R Markdown file that provides complete, easy-to-read code, output, and explanations (there are no explanations in this homework) for the following exercises. Each exercise is independent from the others and should start with the full txhousing dataset. 1. Create a new dataset that contains only the city, year, month , and sales variables. 2. Create a new dataset that contains all of the variables except volume and date. 3. Create a new dataset that contains only the data from Dallas. 4. Create a new dataset of only the months with sales of at least 100 units. 5. Create a new dataset of all the data beginning in June of 2006. 6. Create a new dataset that removes all of the months where the median sale price or the total number of sales are missing. 7. Sort the entire dataset so that the fewest number of sales are at the top. 8. Sort the entire dataset, first by city alphabetically, and then so that the largest volume is at the top for each city. 9. Create a dataset that contains only the city , sales , and date variables for Dallas and Houston, and use it to create a line plot of sales versus date with lines colored for each cityStep by Step Solution
There are 3 Steps involved in it
Step: 1

Get Instant Access to Expert-Tailored Solutions
See step-by-step solutions with expert insights and AI powered tools for academic success
Step: 2

Step: 3
Ace Your Homework with AI
Get the answers you need in no time with our AI-driven, step-by-step assistance
Get Started
Data Mining Concepts And Techniques
Authors: Jiawei Han, Micheline Kamber, Jian Pei
3rd Edition
0123814790, 9780123814791