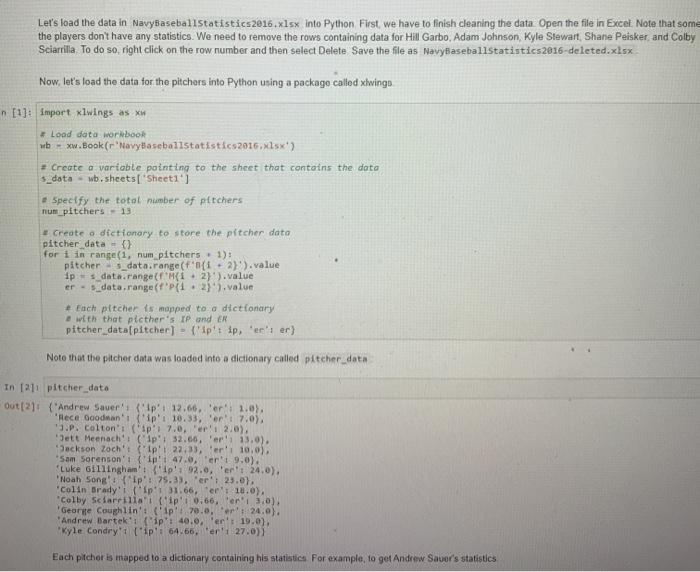
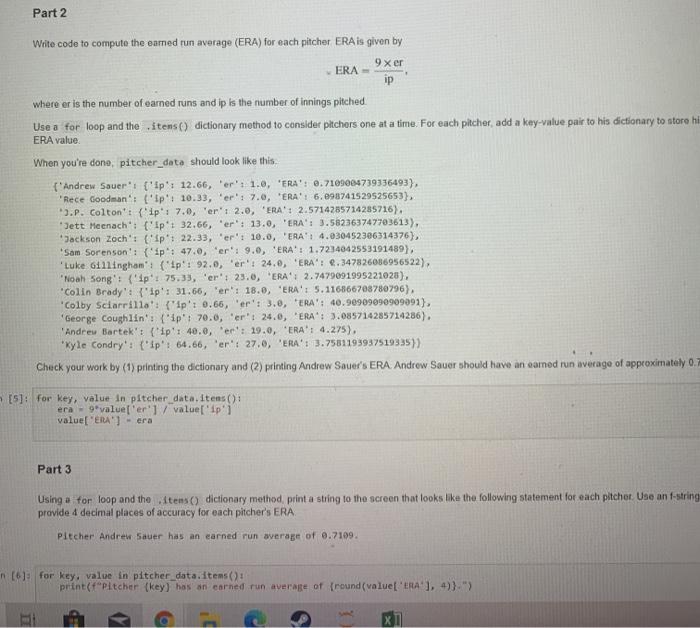
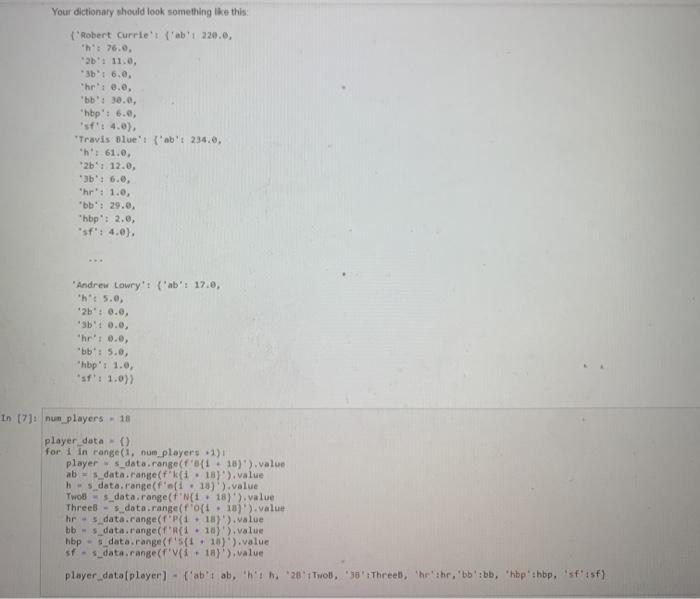
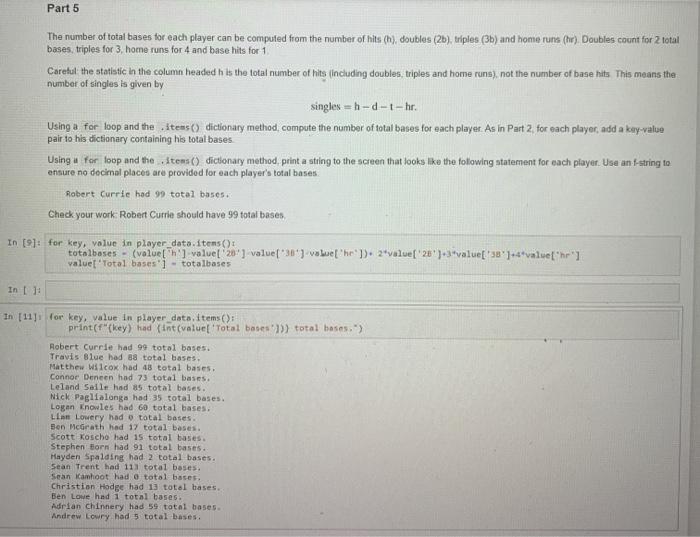
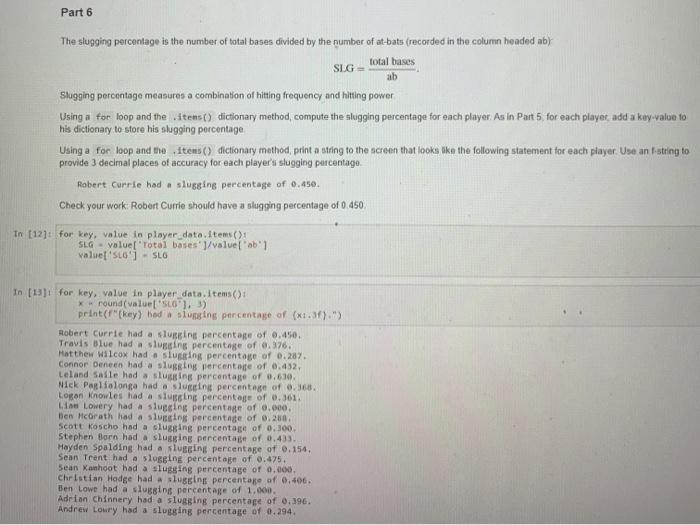
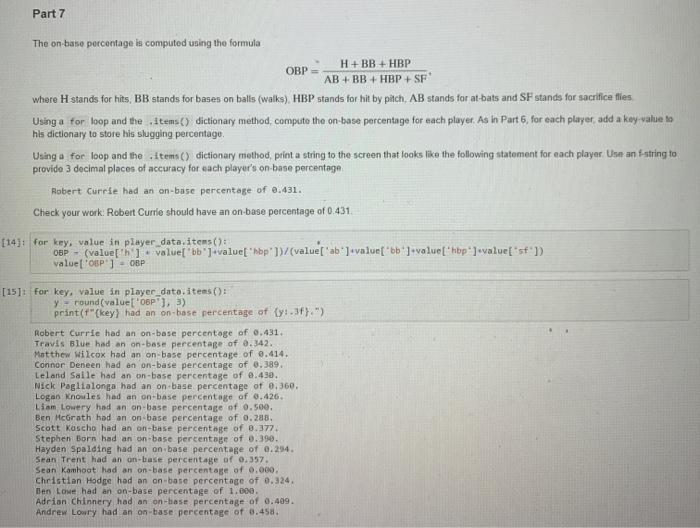
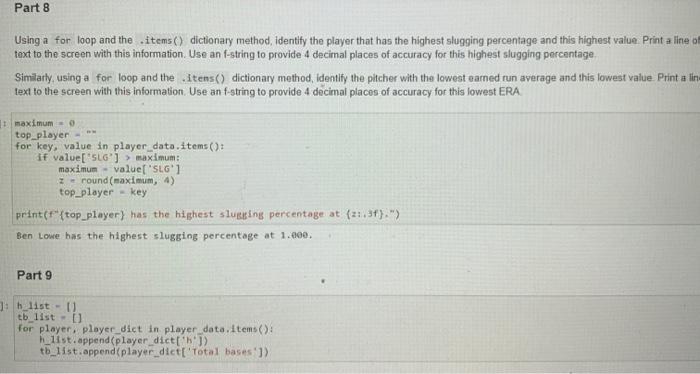
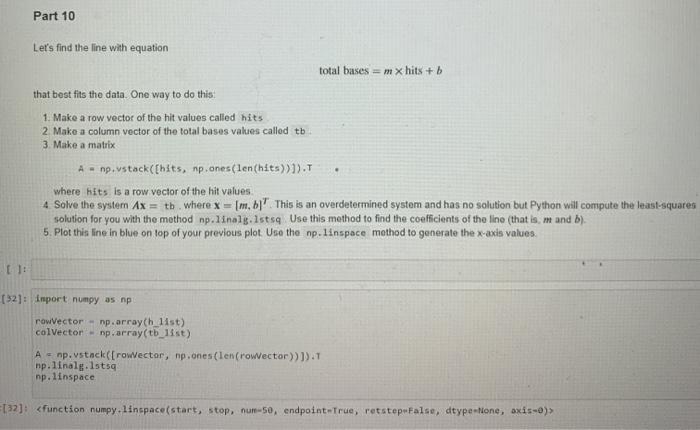
Let's load the data in NavyBaseballstatistics2016.xlsx into Python First we have to finish cleaning the data Open the file in Excel. Note that some the players don't have any statistics. We need to remove the rows containing data for Hill Garbo, Adam Johnson, Kyle Stewart, Shane Peisker and Colby Sciarrilla To do so right click on the row number and then select Delete Save the file as Navy Baseballstatistics2016-deleted.xlsx Now let's load the data for the pitchers into Python using a package called xlwingo [1]; import xlwings as x + Load data workbook ubxw.Book (r NavyaseballStatistics 2016.xlsx) + Create a variable pointing to the sheet that contains the data s_data - wb.sheets Sheet1'] Specify the total number of pitchers num pitchers - 13 Create a dictionary to store the pitcher data pitcher data - ) for i in range(1, num pitchers - 1): pitchers_data.range (f(i - 2}').value fp = $data. range(M(1.2)).value er - s_data.range("P(1.2) 3.value + Each pitcher is mapped to a dictionary with that picther's IP and en pitcher_data(pitcher) = ('ipit ipfe's er} Note that the pitcher data was loaded into a dictionary called pitcher data In [211 pitcher data Out (2Andrew Sauer' l' 12.66, 1.0), "Rece Goodman' ('ip' 10.33, 'ert 7.0), 3.P. Colton' ('ip' 7.0, eri 2/0) Sett Meenach' ('ip'! 32.60, 'r' 13.0). Jackson Zoch' (Ipt 22:33, 10,0), Sam Sorenson't l'ip'i 47.0, eri 9.0). Luke Gillingham': {'p' 92.0, er: 24.0), Noah Song' ('ip'i 75.33. 'er': 23.0) 'Colin Brady' l'ip'i 31.66, ert 18.0), "Colby Sciarrila ('ip'i 0.66, er 3.0) George Coughlin't c'ip' 70.0, 24.0). *Andrew Bartek ('ip' 40.0, 'en't 19.0). Kyle Condry'i l'ip': 64.66, 'er' 27.0) Each pitcher is mapped to a dictionary containing his statistics for example, to get Andrew Saver's statistics Part 2 Write code to compute the eamed run average (ERA) for each pitcher ERA is given by 9 x er ERA- ip where er is the number of earned runs and ip is the number of innings pitched Use a for loop and the items() dictionary method to consider pitchers one at a time. For each pitcher, add a key-value pair to his dictionary to store hi ERA value When you're dono, pitcher_data should look like this ('Andrew Sauer' f'ip': 12.66, 'er': 1.0, 'ERA': 0.7189004739336493), "Rece Goodman': l'ip': 10.33, er': 7.0, "ERA': 6.698741529525653) 3.P. Colton': {'ip': 7.0, 'er': 2.0, "ERA': 2.5714285714285716), "Jett Meenach': {'ip' 32.66, 'er': 13.0, 'ERA': 3.582363747703613), Jackson Zoch': {'ip': 22.33, er': 10.0, 'ERA 4.030452306314376), Sam Sorenson': {'ip': 47.0, "er': 9.0, 'ERA': 1.7234042553191489), "Luke Gillingham ('ip': 92.0, 'er': 24.0, 'ERA: 8.347826036956522), Noah Song' ('ip: 75.33, 'er': 23.0, "ERA' 2.7479091995221028), "Colin Brady': {'ip': 31.66, 'e': 18.0, ERA'5.116866708780796) Colby Sciarrilla': {'ip': 0.66, er': 3.0, ERAT: 40.90909090909091). George Coughlin': {'ip': 70.0, ert 24.0, "ERA: 3.085714285714286). Andrew Bartek': {'ip': 40.0, "eet: 19.0, "ERA' : 4.275). "Kyle Condry': {'ip': 64.66, 'er: 27.0, 'ERA: 3.7581199937519335) Check your work by (1) printing the dictionary and (2) printing Andrew Sauer's ERA. Andrew Sauer should have an earned run average of approximately 0.7 . [5]: for key, value in pitcher_data. Itens(): era - O valuel'er'l value'ip' 1 values "ERA - era Part 3 Using a for loop and the items dictionary method, print a string to the screen that looks like the following statement for each pitcher. Use an f-string provide a decimal places of accuracy for each pitcher's ERA Pitcher Andrew Sauer has an earned run average of 2.7109. n (6 for key, value in pitcher data.items(): print("pitcher (key) has an earned run average of round(valueL'ERA'], 4)}"> Your dictionary should look something like this: ('Robert Curriet ('ab' 220.0, h 76.0. 2b. 11.0 "3b" 6.0. "hr":0.0, 'b' 30.0, "hop': 6.0, sfit 4.0). Travis Blue': {'a': 234.0, h 61.0, 2b: 12.0, 3b 6.0, "hr': 1.0, "bb: 29.0 "hop': 2.0, sf: 4.0) "Andrew Lowry' ('ab': 17.0, "ht 5.0, 2b": 3.0 310.0, "hr":0.0, "bb: 5.0 "hbp' 1.0, 'f': 1.0) In t7): nun players - 18 player data for I in range(1, num players +1) players_data.range( fi. 18)').value ab - data.range("k( 118)').value h - s_data, range(f'oli. 15)').value Two - s_data. range(f'N( 118)').value Three - data range(f 'ofi 18)').value hr $data.range("P(1.1)).value bbs_data. range(R. 187).value hbp - data.range('51. 16) ).value sf - s_data.range(fi. 18').value player_data(player) ('a't ab, ' Wh. 20 Twoul, '38': Threel, hehe, 'bb ebb, hbpehbp. 'st'isf) Part 5 The number of total bases for each player can be computed from the number of hits (1), doubles (2b), triples (3b) and home runs (w). Doubles count for 2 total bases, triples for 3, home runs for 4 and base hits for 1 Caretul the statistic in the column headed he is the total number of hits (including doubles, triples and home runs), not the number of base hits. This means the number of singles is given by singles h-d-1-hr. Using a for loop and the items () dictionary method, compute the number of total bases for each player. As in Part 2, for each player, add a kuy-value pair to his dictionary containing his total bases Using a for loop and the items() dictionary method, print a string to the screen that looks like the following statement for each player. Use an f-string to ensure no decimal places are provided for each player's total bases Robert Currie hod 99 total bases. Check your work Robert Currie should have 99 total bases In 91: for key, value in player_data. items totalboses - (voluel" value 20'] value '30") valvel'he']). 2*value 20')-3*value['38']4*value["hr"] valuel'Total bases'i - totalbases In 1: In [11] for key, value in player_data, items(); print("key) had int(value! Total bases'])) total bases.) Robert Currie had 99 total bases. Travis Blue had 88 total bases. Matthew Wilcox had 48 total bases. Connor Deneen had 73 total bases. Leland Salle had 85 total bases. Nick Paglialonga had 35 total bases. Logan Knowles had 60 total bases. Linn Lowery had o total bases Ben Mcorath had 17 total bases. Scott Koscho had 15 total bases. Stephen Born had 91 total bases. Mayden Spalding had 2 total bases. Sean Trent had 113 total bases. Sean Kamboot had a total bases Christian Hodge had 13 total bases. Ben Lowe had 1 total bases. Adrian Chinnery had 59 total bases. Andrew Lowry had 5 total bases. Part 6 The slugging percentage is the number of total bases divided by the number of at-bats (recorded in the column headed by total bases SLG ab Slugging percentage measures a combination of hitting frequency and hitting power Using a for loop and the items() dictionary method, compute the slugging percentage for each player. As in Part 5 for each playet, add a key-value to his dictionary to store his slugging percentage Using a for loop and the items() dictionary method, print a string to the screen that looks like the following statement for each player. Use an t-string to provide 3 decimal places of accuracy for each player's slugging percentage Robert Currie hod slugging percentage of 0.450. Check your work Robert Currie should have a slugging percentage of 0.450 In [12]: for key, value in player_date.items(): SLG valuel'Total bases']/value"'1 valuel'S10'- SLO In [13] for key, value in player data.Items() * round(valueSLO), 3) print("key) had slunging percentage of (x1.3f)) Robert Currie had a slun percentage of 0.450. Travis Blue had a slussing percentage of 0.376. Matthew Wilcox had a slussing percentage of 0.287. Connor Deneen had a slussing percentage of 0.432 Leland Saile had a slugging percentage of 0.619. Nick Parlialonga had a sluain percentage of 0.368 Logon Knowles had a slusaine percentage of 0.361 Lo Lowery had a slucing percentage of 6.000 Ben McGrath had a slun percentage of 0.280, Scott Koscho had a slussing percentage of 0.300 Stephen Born had a slugging percentage of 0.433. Hayden Spalding had a slugging percentage of 0.154. Sean Trent had a slusging percentage of 0.475. Sean Kanhoot had a slugging percentage of 0.000 Christian Hodge had slugging percentage of 0.406. Ben Lowe had a sluagine percentage of 1.000 Adrian Chinnery had a slugging percentage of 0.396. Andrew Lourly had a slugging percentage of 0.294. Part 7 The on-base percentage is computed using the formula H + BB + HBP OBP AB + BB4 HBP + SF where H stands for hits, BB stands for bases on balis (walks), HBP stands for hit by pitch, AB stands for at-bats and SF stands for sacrifice flies Using a for loop and the items() dictionary method, compute the on-base percentage for each player. As in Part 6, for each player, add a key value to his dictionary to store his slugging percentage Using a for loop and the .Items() dictionary method, print a string to the screen that looks like the following statement for each player Use an f-string to provide 3 decimal places of accuracy for each player's on base percentage Robert Currie had an on-base percentage of 0.431. Check your work. Robert Currie should have an on-base percentage of 0.431 [14]: for key, value in player data.items(): 0BP - (value the valuel "bb J-value['hp'))/(value ab evalue bb jevaluel' hbpjevalueList"] value['OP] -OBP [15]: for key, value in player_data.itens(): y = round(value['OBP'), 3) print(1 "(key) had an on-base percentage of by:.3f):) Robert Currie had an on-base percentage of 0.431. Travis Blue had an on-base percentage of 0.342. Matthew Wilcox had an on-base percentage of 0.414. Connor Deneen had an on-base percentage of 0.389. Leland Salle had an on-base percentage of 0.430. Nick Poglialonga had an on-base percentage of 0.360. Logan Knowles had an on-base percentage of 0.426. Liom Lowery had an on-base percentage of 0.500. Ben McGrath had an on-base percentage of 0.285. Scott Kascho had an on-base percentage of 0.377. Stephen Born had an on-base percentage of 1.390. Hayden Spalding had an on-base percentage of 0.294. Sean Trent had an on-base percentage of 0.357. Sean Kamhoot had an on-base percentage of 0.000 Christian Hodge had an on-base percentage of 0.324. Ben Lowe had an on-base percentage of 1.000 Adrian Chinnery had an on-base percentage of 0.409. Andrew Lovry had an on-base percentage of 0.458. Part 8 Using a for loop and the items() dictionary method, identify the player that has the highest slugging percentage and this highest value. Print a line of text to the screen with this information. Use an f-string to provide 4 decimal places of accuracy for this highest slugging percentage Similarly, using a for loop and the .Itens() dictionary method, identify the pitcher with the lowest earned run average and this lowest value. Print a in text to the screen with this information. Use an f-string to provide 4 decimal places of accuracy for this lowest ERA It maximum = 0 top_player for key, value in player_dato. items(): if value[SLG'] > maximum: maximum valuer 'SLG'] z round(maximum, 4) top_player - key print(f {top_player) has the highest slusring percentage at (2:38).) Ben Lowe has the highest slugging percentage at 1.000. Part 9 h_list - tb list - 0 for player, player_dict in player_data. Items() _list.append(player dict('']) th_list.append(player_dict['Total bases']) Part 10 Let's find the line with equation total bases = mx hits + b that best fits the data. One way to do this: 1. Make a row vector of the hit values called hits 2. Make a column vector of the total bases values called tb 3. Make a matrix A np.vstack([hits, np.ones(len (hits))]).T where hits is a row vector of the hit values 4 Solve the system Ax = tb. where x = [m, bl. This is an overdetermined system and has no solution but Python will compute the least-squares solution for you with the method np. linalg.lsts. Use this method to find the coefficients of the line that is mand b). 5. Plot this line in blue on top of your previous plot Use the np. linspace method to generate the x-axis values. (32): inport numpy as np rowVector - np.array(h_list) colVector - np.array(tb_list) A - np.vstack( [rowvector, np.ones(len (rowvector))]).T np. linalg.lsts np. linspace 132]: function numpy.linspace(start, stop, num-50, endpoint-True, retstep False, dtype=None, axis-o) Let's load the data in NavyBaseballstatistics2016.xlsx into Python First we have to finish cleaning the data Open the file in Excel. Note that some the players don't have any statistics. We need to remove the rows containing data for Hill Garbo, Adam Johnson, Kyle Stewart, Shane Peisker and Colby Sciarrilla To do so right click on the row number and then select Delete Save the file as Navy Baseballstatistics2016-deleted.xlsx Now let's load the data for the pitchers into Python using a package called xlwingo [1]; import xlwings as x + Load data workbook ubxw.Book (r NavyaseballStatistics 2016.xlsx) + Create a variable pointing to the sheet that contains the data s_data - wb.sheets Sheet1'] Specify the total number of pitchers num pitchers - 13 Create a dictionary to store the pitcher data pitcher data - ) for i in range(1, num pitchers - 1): pitchers_data.range (f(i - 2}').value fp = $data. range(M(1.2)).value er - s_data.range("P(1.2) 3.value + Each pitcher is mapped to a dictionary with that picther's IP and en pitcher_data(pitcher) = ('ipit ipfe's er} Note that the pitcher data was loaded into a dictionary called pitcher data In [211 pitcher data Out (2Andrew Sauer' l' 12.66, 1.0), "Rece Goodman' ('ip' 10.33, 'ert 7.0), 3.P. Colton' ('ip' 7.0, eri 2/0) Sett Meenach' ('ip'! 32.60, 'r' 13.0). Jackson Zoch' (Ipt 22:33, 10,0), Sam Sorenson't l'ip'i 47.0, eri 9.0). Luke Gillingham': {'p' 92.0, er: 24.0), Noah Song' ('ip'i 75.33. 'er': 23.0) 'Colin Brady' l'ip'i 31.66, ert 18.0), "Colby Sciarrila ('ip'i 0.66, er 3.0) George Coughlin't c'ip' 70.0, 24.0). *Andrew Bartek ('ip' 40.0, 'en't 19.0). Kyle Condry'i l'ip': 64.66, 'er' 27.0) Each pitcher is mapped to a dictionary containing his statistics for example, to get Andrew Saver's statistics Part 2 Write code to compute the eamed run average (ERA) for each pitcher ERA is given by 9 x er ERA- ip where er is the number of earned runs and ip is the number of innings pitched Use a for loop and the items() dictionary method to consider pitchers one at a time. For each pitcher, add a key-value pair to his dictionary to store hi ERA value When you're dono, pitcher_data should look like this ('Andrew Sauer' f'ip': 12.66, 'er': 1.0, 'ERA': 0.7189004739336493), "Rece Goodman': l'ip': 10.33, er': 7.0, "ERA': 6.698741529525653) 3.P. Colton': {'ip': 7.0, 'er': 2.0, "ERA': 2.5714285714285716), "Jett Meenach': {'ip' 32.66, 'er': 13.0, 'ERA': 3.582363747703613), Jackson Zoch': {'ip': 22.33, er': 10.0, 'ERA 4.030452306314376), Sam Sorenson': {'ip': 47.0, "er': 9.0, 'ERA': 1.7234042553191489), "Luke Gillingham ('ip': 92.0, 'er': 24.0, 'ERA: 8.347826036956522), Noah Song' ('ip: 75.33, 'er': 23.0, "ERA' 2.7479091995221028), "Colin Brady': {'ip': 31.66, 'e': 18.0, ERA'5.116866708780796) Colby Sciarrilla': {'ip': 0.66, er': 3.0, ERAT: 40.90909090909091). George Coughlin': {'ip': 70.0, ert 24.0, "ERA: 3.085714285714286). Andrew Bartek': {'ip': 40.0, "eet: 19.0, "ERA' : 4.275). "Kyle Condry': {'ip': 64.66, 'er: 27.0, 'ERA: 3.7581199937519335) Check your work by (1) printing the dictionary and (2) printing Andrew Sauer's ERA. Andrew Sauer should have an earned run average of approximately 0.7 . [5]: for key, value in pitcher_data. Itens(): era - O valuel'er'l value'ip' 1 values "ERA - era Part 3 Using a for loop and the items dictionary method, print a string to the screen that looks like the following statement for each pitcher. Use an f-string provide a decimal places of accuracy for each pitcher's ERA Pitcher Andrew Sauer has an earned run average of 2.7109. n (6 for key, value in pitcher data.items(): print("pitcher (key) has an earned run average of round(valueL'ERA'], 4)}"> Your dictionary should look something like this: ('Robert Curriet ('ab' 220.0, h 76.0. 2b. 11.0 "3b" 6.0. "hr":0.0, 'b' 30.0, "hop': 6.0, sfit 4.0). Travis Blue': {'a': 234.0, h 61.0, 2b: 12.0, 3b 6.0, "hr': 1.0, "bb: 29.0 "hop': 2.0, sf: 4.0) "Andrew Lowry' ('ab': 17.0, "ht 5.0, 2b": 3.0 310.0, "hr":0.0, "bb: 5.0 "hbp' 1.0, 'f': 1.0) In t7): nun players - 18 player data for I in range(1, num players +1) players_data.range( fi. 18)').value ab - data.range("k( 118)').value h - s_data, range(f'oli. 15)').value Two - s_data. range(f'N( 118)').value Three - data range(f 'ofi 18)').value hr $data.range("P(1.1)).value bbs_data. range(R. 187).value hbp - data.range('51. 16) ).value sf - s_data.range(fi. 18').value player_data(player) ('a't ab, ' Wh. 20 Twoul, '38': Threel, hehe, 'bb ebb, hbpehbp. 'st'isf) Part 5 The number of total bases for each player can be computed from the number of hits (1), doubles (2b), triples (3b) and home runs (w). Doubles count for 2 total bases, triples for 3, home runs for 4 and base hits for 1 Caretul the statistic in the column headed he is the total number of hits (including doubles, triples and home runs), not the number of base hits. This means the number of singles is given by singles h-d-1-hr. Using a for loop and the items () dictionary method, compute the number of total bases for each player. As in Part 2, for each player, add a kuy-value pair to his dictionary containing his total bases Using a for loop and the items() dictionary method, print a string to the screen that looks like the following statement for each player. Use an f-string to ensure no decimal places are provided for each player's total bases Robert Currie hod 99 total bases. Check your work Robert Currie should have 99 total bases In 91: for key, value in player_data. items totalboses - (voluel" value 20'] value '30") valvel'he']). 2*value 20')-3*value['38']4*value["hr"] valuel'Total bases'i - totalbases In 1: In [11] for key, value in player_data, items(); print("key) had int(value! Total bases'])) total bases.) Robert Currie had 99 total bases. Travis Blue had 88 total bases. Matthew Wilcox had 48 total bases. Connor Deneen had 73 total bases. Leland Salle had 85 total bases. Nick Paglialonga had 35 total bases. Logan Knowles had 60 total bases. Linn Lowery had o total bases Ben Mcorath had 17 total bases. Scott Koscho had 15 total bases. Stephen Born had 91 total bases. Mayden Spalding had 2 total bases. Sean Trent had 113 total bases. Sean Kamboot had a total bases Christian Hodge had 13 total bases. Ben Lowe had 1 total bases. Adrian Chinnery had 59 total bases. Andrew Lowry had 5 total bases. Part 6 The slugging percentage is the number of total bases divided by the number of at-bats (recorded in the column headed by total bases SLG ab Slugging percentage measures a combination of hitting frequency and hitting power Using a for loop and the items() dictionary method, compute the slugging percentage for each player. As in Part 5 for each playet, add a key-value to his dictionary to store his slugging percentage Using a for loop and the items() dictionary method, print a string to the screen that looks like the following statement for each player. Use an t-string to provide 3 decimal places of accuracy for each player's slugging percentage Robert Currie hod slugging percentage of 0.450. Check your work Robert Currie should have a slugging percentage of 0.450 In [12]: for key, value in player_date.items(): SLG valuel'Total bases']/value"'1 valuel'S10'- SLO In [13] for key, value in player data.Items() * round(valueSLO), 3) print("key) had slunging percentage of (x1.3f)) Robert Currie had a slun percentage of 0.450. Travis Blue had a slussing percentage of 0.376. Matthew Wilcox had a slussing percentage of 0.287. Connor Deneen had a slussing percentage of 0.432 Leland Saile had a slugging percentage of 0.619. Nick Parlialonga had a sluain percentage of 0.368 Logon Knowles had a slusaine percentage of 0.361 Lo Lowery had a slucing percentage of 6.000 Ben McGrath had a slun percentage of 0.280, Scott Koscho had a slussing percentage of 0.300 Stephen Born had a slugging percentage of 0.433. Hayden Spalding had a slugging percentage of 0.154. Sean Trent had a slusging percentage of 0.475. Sean Kanhoot had a slugging percentage of 0.000 Christian Hodge had slugging percentage of 0.406. Ben Lowe had a sluagine percentage of 1.000 Adrian Chinnery had a slugging percentage of 0.396. Andrew Lourly had a slugging percentage of 0.294. Part 7 The on-base percentage is computed using the formula H + BB + HBP OBP AB + BB4 HBP + SF where H stands for hits, BB stands for bases on balis (walks), HBP stands for hit by pitch, AB stands for at-bats and SF stands for sacrifice flies Using a for loop and the items() dictionary method, compute the on-base percentage for each player. As in Part 6, for each player, add a key value to his dictionary to store his slugging percentage Using a for loop and the .Items() dictionary method, print a string to the screen that looks like the following statement for each player Use an f-string to provide 3 decimal places of accuracy for each player's on base percentage Robert Currie had an on-base percentage of 0.431. Check your work. Robert Currie should have an on-base percentage of 0.431 [14]: for key, value in player data.items(): 0BP - (value the valuel "bb J-value['hp'))/(value ab evalue bb jevaluel' hbpjevalueList"] value['OP] -OBP [15]: for key, value in player_data.itens(): y = round(value['OBP'), 3) print(1 "(key) had an on-base percentage of by:.3f):) Robert Currie had an on-base percentage of 0.431. Travis Blue had an on-base percentage of 0.342. Matthew Wilcox had an on-base percentage of 0.414. Connor Deneen had an on-base percentage of 0.389. Leland Salle had an on-base percentage of 0.430. Nick Poglialonga had an on-base percentage of 0.360. Logan Knowles had an on-base percentage of 0.426. Liom Lowery had an on-base percentage of 0.500. Ben McGrath had an on-base percentage of 0.285. Scott Kascho had an on-base percentage of 0.377. Stephen Born had an on-base percentage of 1.390. Hayden Spalding had an on-base percentage of 0.294. Sean Trent had an on-base percentage of 0.357. Sean Kamhoot had an on-base percentage of 0.000 Christian Hodge had an on-base percentage of 0.324. Ben Lowe had an on-base percentage of 1.000 Adrian Chinnery had an on-base percentage of 0.409. Andrew Lovry had an on-base percentage of 0.458. Part 8 Using a for loop and the items() dictionary method, identify the player that has the highest slugging percentage and this highest value. Print a line of text to the screen with this information. Use an f-string to provide 4 decimal places of accuracy for this highest slugging percentage Similarly, using a for loop and the .Itens() dictionary method, identify the pitcher with the lowest earned run average and this lowest value. Print a in text to the screen with this information. Use an f-string to provide 4 decimal places of accuracy for this lowest ERA It maximum = 0 top_player for key, value in player_dato. items(): if value[SLG'] > maximum: maximum valuer 'SLG'] z round(maximum, 4) top_player - key print(f {top_player) has the highest slusring percentage at (2:38).) Ben Lowe has the highest slugging percentage at 1.000. Part 9 h_list - tb list - 0 for player, player_dict in player_data. Items() _list.append(player dict('']) th_list.append(player_dict['Total bases']) Part 10 Let's find the line with equation total bases = mx hits + b that best fits the data. One way to do this: 1. Make a row vector of the hit values called hits 2. Make a column vector of the total bases values called tb 3. Make a matrix A np.vstack([hits, np.ones(len (hits))]).T where hits is a row vector of the hit values 4 Solve the system Ax = tb. where x = [m, bl. This is an overdetermined system and has no solution but Python will compute the least-squares solution for you with the method np. linalg.lsts. Use this method to find the coefficients of the line that is mand b). 5. Plot this line in blue on top of your previous plot Use the np. linspace method to generate the x-axis values. (32): inport numpy as np rowVector - np.array(h_list) colVector - np.array(tb_list) A - np.vstack( [rowvector, np.ones(len (rowvector))]).T np. linalg.lsts np. linspace 132]: function numpy.linspace(start, stop, num-50, endpoint-True, retstep False, dtype=None, axis-o)
