

Answered step by step
Verified Expert Solution
Question
1 Approved Answer
HELP! Please explain in detail! 3. Plot In Pio vs VT(K) for the tempkrature range 800 to 1500 K, usingthe results of Fig. 6-6. PSICPR
HELP! Please explain in detail!
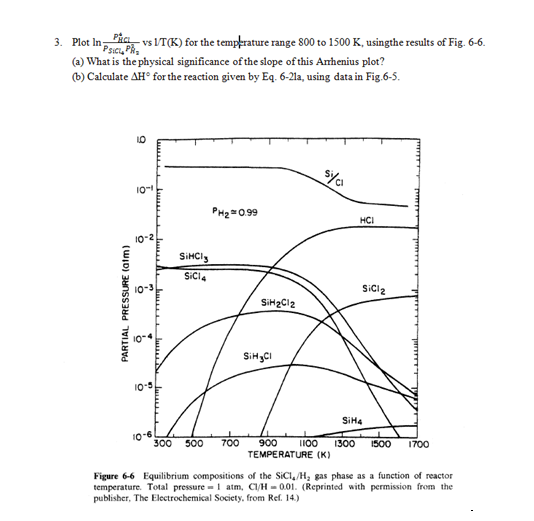
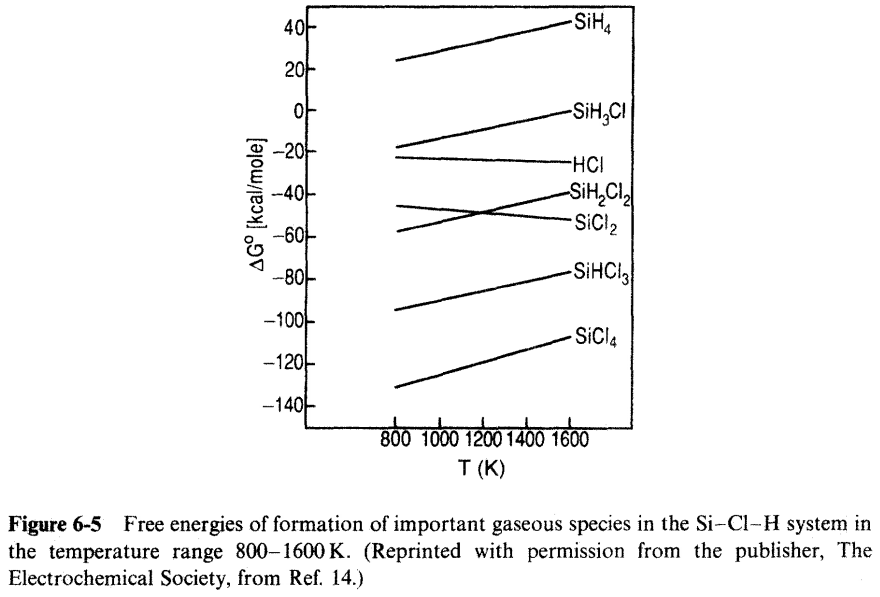
3. Plot In Pio vs VT(K) for the tempkrature range 800 to 1500 K, usingthe results of Fig. 6-6. PSICPR (a) What is the physical significance of the slope of this Anthenius plot? 6) Calculate AH for the reaction given by Eq. 6-21a, using data in Fig.6-5. Syai 101 PH2 0.99 HCI 10-2 SiMCI SiCl4 Siciz PARTIAL PRESSURE (aim) SiH2C12 SiHCI 10-5 Imm SiH 10-6 300 500 700 900 1100 1300 TEMPERATURE (K) 1500 1700 Figure 6-6 Equilibrium compositions of the Sici, /H, gas phase as a function of reactor temperature. Total pressure atm, C/H -0.01. (Reprinted with permission from the publisher, The Electrochemical Society, from Ref. 14.) 40F -SIHA 20F OF -SiH,C! - 204 --404 AG [kcal/mole) -HCI -SiH,CII -SiCl2 -60% -80% -SIHC13 -100% Sicla -1204 -1406 800 1000 1200 1400 1600 T(K) Figure 6-5 Free energies of formation of important gaseous species in the Si-Cl-H system in the temperature range 800-1600 K. (Reprinted with permission from the publisher, The Electrochemical Society, from Ref. 14.) SiCl419) + 2H2(g) =Si(s) + 4HCI(g); K (as:) PHC Psici, PL (6-21a)Step by Step Solution
There are 3 Steps involved in it
Step: 1

Get Instant Access to Expert-Tailored Solutions
See step-by-step solutions with expert insights and AI powered tools for academic success
Step: 2

Step: 3
Ace Your Homework with AI
Get the answers you need in no time with our AI-driven, step-by-step assistance
Get Started
Minimally Processed Foods Technologies For Safety Quality And Convenience
Authors: Mohammed Wasim Siddiqui, Mohammad Shafiur Rahman
1st Edition
3319106767, 978-3319106762