Help please! I have to put my answers in as formulas.
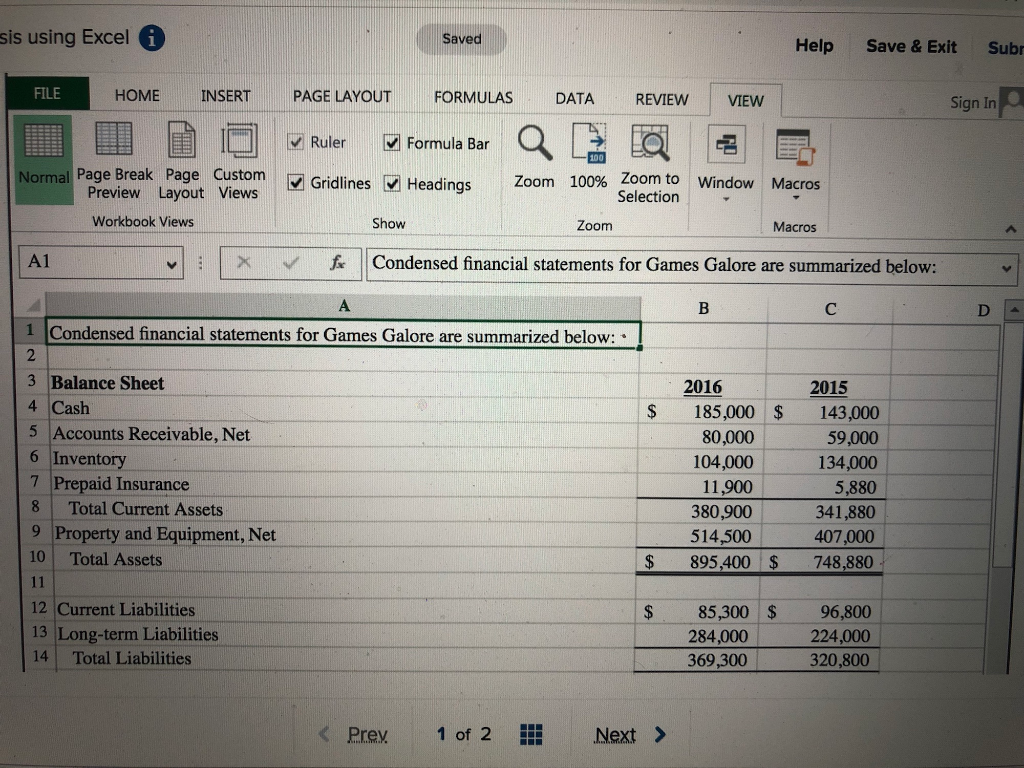
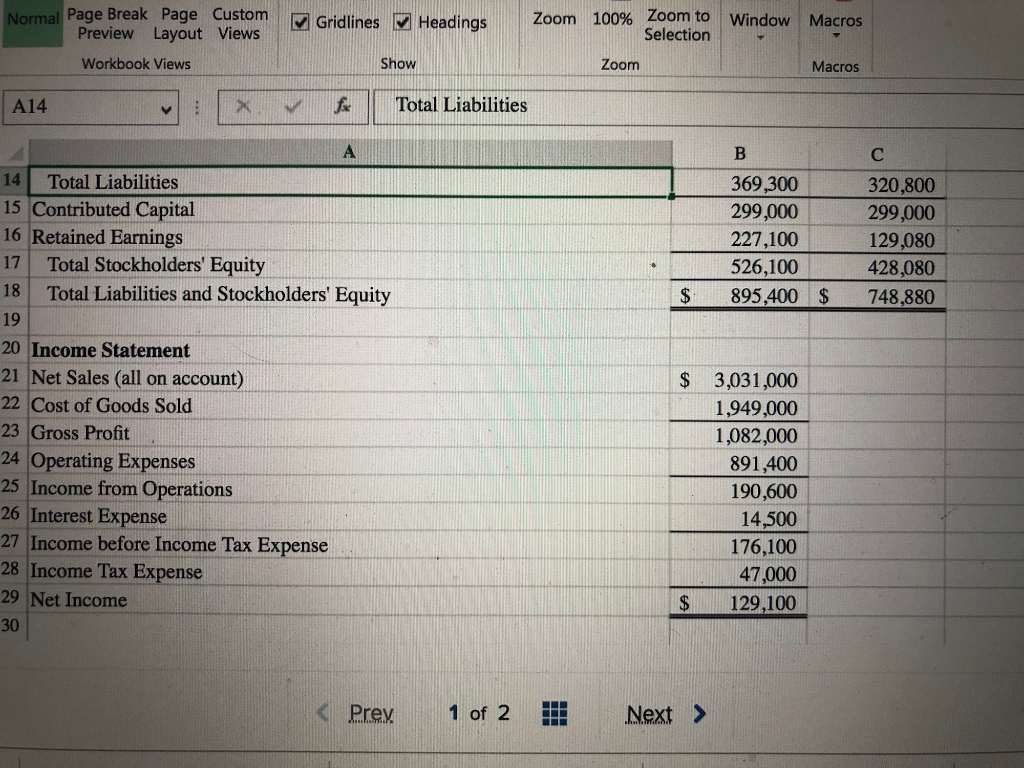
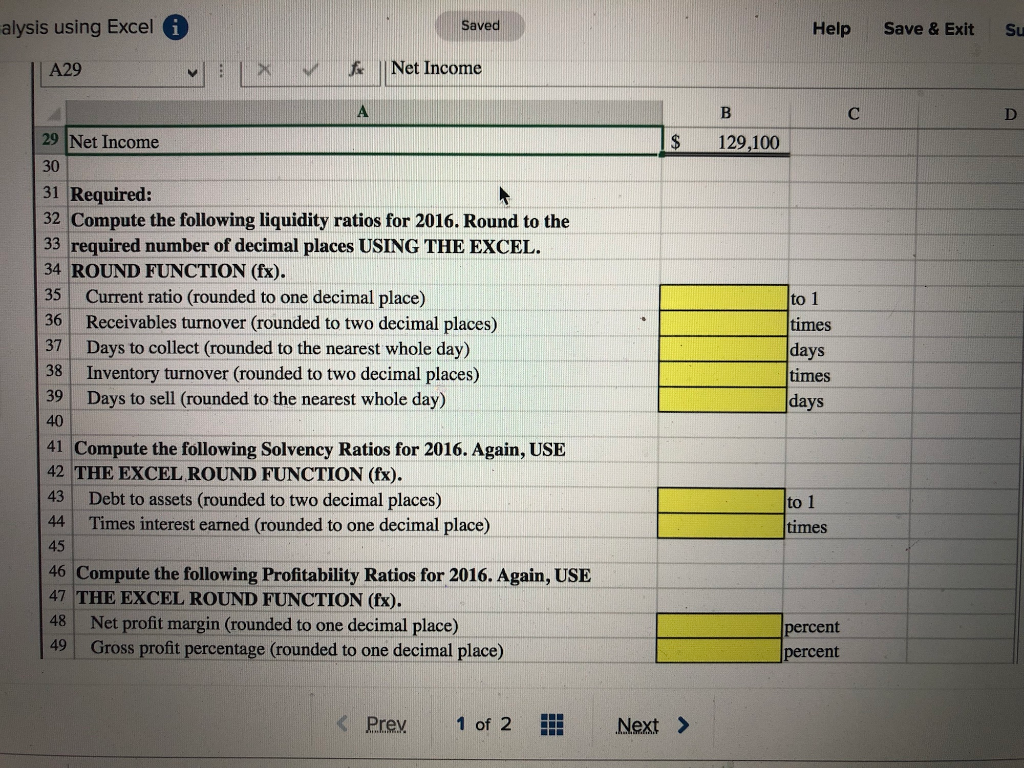
sis using Excel Saved Help Save & Exit Subr FILE HOME INSERTPAGE LAYOUT FORMULAS DATA REVIEW VIEW Sign In Ruler Formula Bar K Gridlines M Headings Zoom 100% Zoom to Window Macros Normal Page Break Page Custom Preview Layout Views Selection Workbook Views Show Macros Zoom vx fCondensed financial statements for Games Galore are summarized below: A1 1 Condensed financial statements for Games Galore are summarized below: 3 Balance Sheet 4 Cash 5 Accounts Receivable, Net 6 Inventory 7 Prepaid Insurance 8 Total Current Assets 9 Property and Equipment, Net 10 Total Assets 2016 2015 S 185,000 $ 143,000 59,000 134,000 5,880 341,880 407,000 $895,400 748,880 80,000 104,000 11,900 380,900 514,500 12 Current Liabilities 13 Long-term Liabilities 14 Total Liabilities S 85,300 $ 96,800 284000 224000 369,300 320,800 orma Page Break Layout Custom y Gridlines Zoom 100% Zoom to Window Macros Headings Preview Layout Views Show Workbook Views Zoom Macros X.V Total Liabilities A14 14 Total Liabilities 369 300 299,000 320,800 299,000 129,080 428,080 $ 895,400 748,880 15 Contributed Capital 16 Retained Earnings 17 Total Stockholders' Equity 18 Total Liabilities and Stockholders' Equity 19 20 Income Statement 21 Net Sales (all on account) 22 Cost of Goods Sold 23 Gross Profit 24 Operating Expenses 25 Income from Operations 26 Interest Expense 27 Income before Income Tax Expense 28 Income Tax Expense 29 Net Income 30 227,100 526,100 $ 3,031,000 1,949,000 1,082,000 891,400 190,600 14,500 176,100 47000 129,100 Prev 1 of 2 Il Next > alysis using Excel Saved Help Save & Exit Su IX Net Income A29 29 Net Income 30 31 Required: 32 Compute the following liquidity ratios for 2016. Round to the 33 required number of decimal places USING THE EXCEL 34 ROUND FUNCTION (fx). 35 Current ratio (rounded to one decimal place) 36 Receivables turnover (rounded to two decimal places) 37 Days to collect (rounded to the nearest whole day) 38 Inventory turnover (rounded to two decimal places) 39 Days to sell (rounded to the nearest whole day) $129,100 to 1 times times days 40 41 Compute the following Solvency Ratios for 2016. Again, USE 42 THE EXCEL ROUND FUNCTION (fx). 43 Debt to assets (rounded to two decimal places) 44 Times interest earned (rounded to one decimal place) to 1 imes 45 46 Compute the following Profitability Ratios for 2016. Again, USE 47 THE EXCEL ROUND FUNCTION (fx). 48 Net profit margin (rounded to one decimal place) 49 Gross profit percentage (rounded to one decimal place) percent percent sis using Excel Saved Help Save & Exit Subr FILE HOME INSERTPAGE LAYOUT FORMULAS DATA REVIEW VIEW Sign In Ruler Formula Bar K Gridlines M Headings Zoom 100% Zoom to Window Macros Normal Page Break Page Custom Preview Layout Views Selection Workbook Views Show Macros Zoom vx fCondensed financial statements for Games Galore are summarized below: A1 1 Condensed financial statements for Games Galore are summarized below: 3 Balance Sheet 4 Cash 5 Accounts Receivable, Net 6 Inventory 7 Prepaid Insurance 8 Total Current Assets 9 Property and Equipment, Net 10 Total Assets 2016 2015 S 185,000 $ 143,000 59,000 134,000 5,880 341,880 407,000 $895,400 748,880 80,000 104,000 11,900 380,900 514,500 12 Current Liabilities 13 Long-term Liabilities 14 Total Liabilities S 85,300 $ 96,800 284000 224000 369,300 320,800 orma Page Break Layout Custom y Gridlines Zoom 100% Zoom to Window Macros Headings Preview Layout Views Show Workbook Views Zoom Macros X.V Total Liabilities A14 14 Total Liabilities 369 300 299,000 320,800 299,000 129,080 428,080 $ 895,400 748,880 15 Contributed Capital 16 Retained Earnings 17 Total Stockholders' Equity 18 Total Liabilities and Stockholders' Equity 19 20 Income Statement 21 Net Sales (all on account) 22 Cost of Goods Sold 23 Gross Profit 24 Operating Expenses 25 Income from Operations 26 Interest Expense 27 Income before Income Tax Expense 28 Income Tax Expense 29 Net Income 30 227,100 526,100 $ 3,031,000 1,949,000 1,082,000 891,400 190,600 14,500 176,100 47000 129,100 Prev 1 of 2 Il Next > alysis using Excel Saved Help Save & Exit Su IX Net Income A29 29 Net Income 30 31 Required: 32 Compute the following liquidity ratios for 2016. Round to the 33 required number of decimal places USING THE EXCEL 34 ROUND FUNCTION (fx). 35 Current ratio (rounded to one decimal place) 36 Receivables turnover (rounded to two decimal places) 37 Days to collect (rounded to the nearest whole day) 38 Inventory turnover (rounded to two decimal places) 39 Days to sell (rounded to the nearest whole day) $129,100 to 1 times times days 40 41 Compute the following Solvency Ratios for 2016. Again, USE 42 THE EXCEL ROUND FUNCTION (fx). 43 Debt to assets (rounded to two decimal places) 44 Times interest earned (rounded to one decimal place) to 1 imes 45 46 Compute the following Profitability Ratios for 2016. Again, USE 47 THE EXCEL ROUND FUNCTION (fx). 48 Net profit margin (rounded to one decimal place) 49 Gross profit percentage (rounded to one decimal place) percent percent


