Answered step by step
Verified Expert Solution
Link Copied!

Question

1 Approved Answer

Help please Now press the mouse button and drag over the next linear region of the curve (the gently sloping section of the curve where

Help please image text in transcribed
Now press the mouse button and drag over the next linear region of the curve (the gently sloping section of the curve where freezing took place). Press the mouse button and hold it down as you drag only this linear region of the curve. Click again. The graph should now have two regression lines displayed. Choose Interpolate from the Analyze menu. Move the mouse pointer left to the point where the two regression lines intersect. When the small circles on each cursor line overlap each other at the intersection, the temperatures shown in either examine box should be equal to the freezing temperature for the benzoic acid-lauric acid mixture

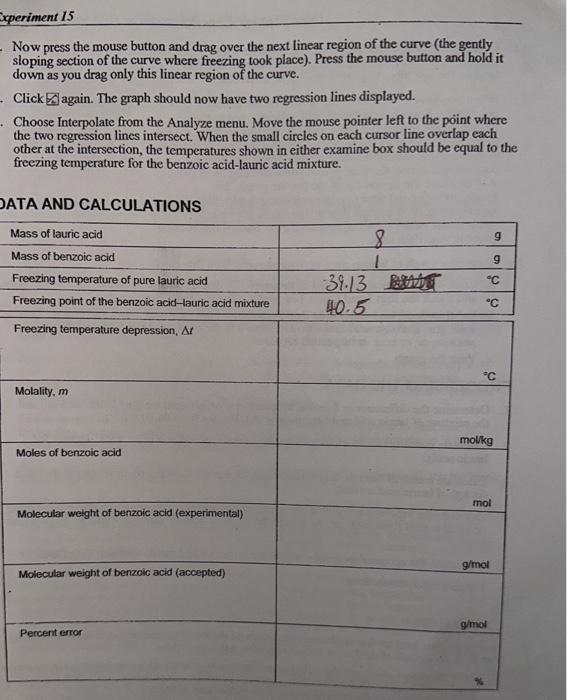
Step by Step Solution

There are 3 Steps involved in it

Step: 1

blur-text-image

Get Instant Access to Expert-Tailored Solutions

See step-by-step solutions with expert insights and AI powered tools for academic success

Step: 2

blur-text-image

Step: 3

blur-text-image

Ace Your Homework with AI

Get the answers you need in no time with our AI-driven, step-by-step assistance

Get Started

Recommended Textbook for

Chemistry

Authors: Jill Robinson, John McMurry, Robert Fay

8th Edition

134856236, 978-0134856230

More Books

Students also viewed these Chemistry questions