Answered step by step
Verified Expert Solution
Question
1 Approved Answer
help please Probability-Row and Column Percents Low Birth Weight Data We will be waeking with data from bittwwights. Downiond the data lile and save to
help please 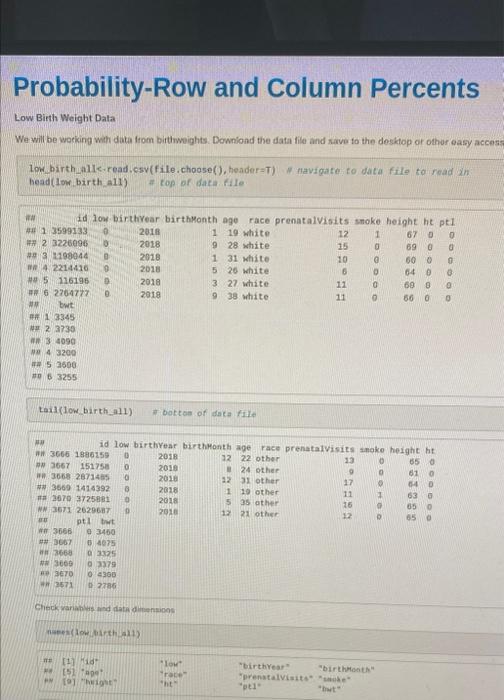
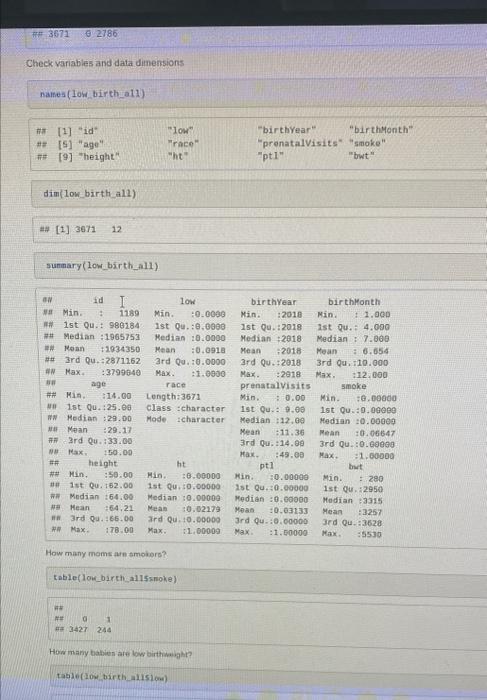
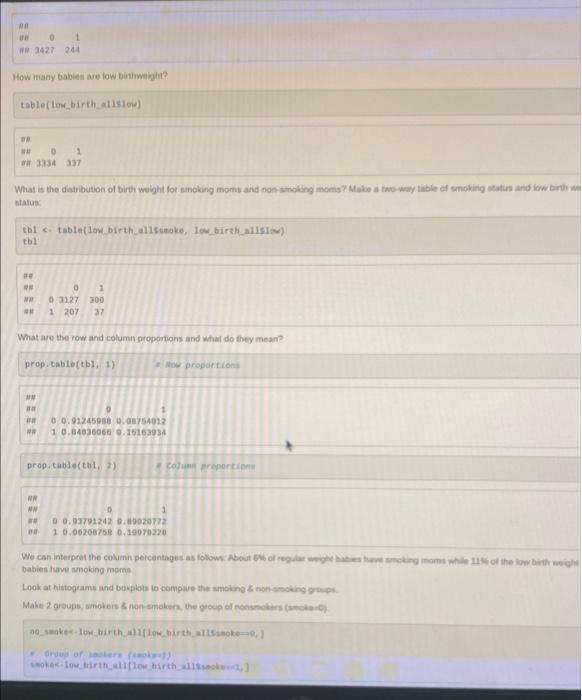
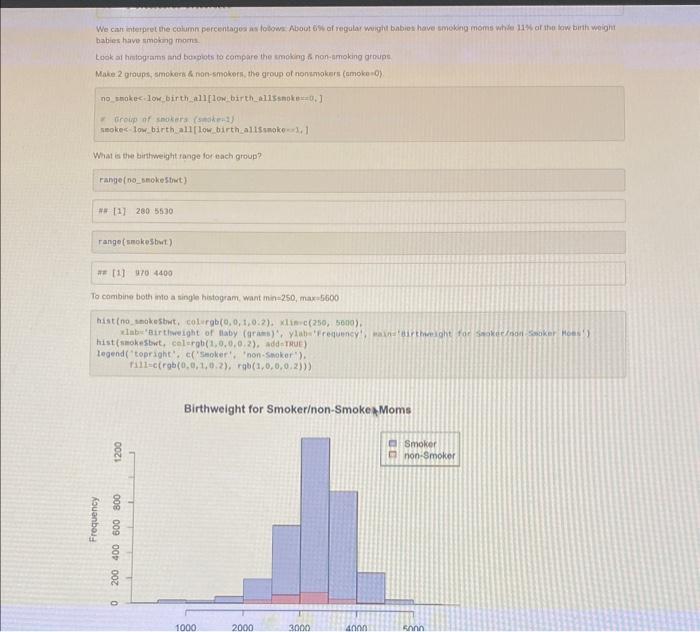
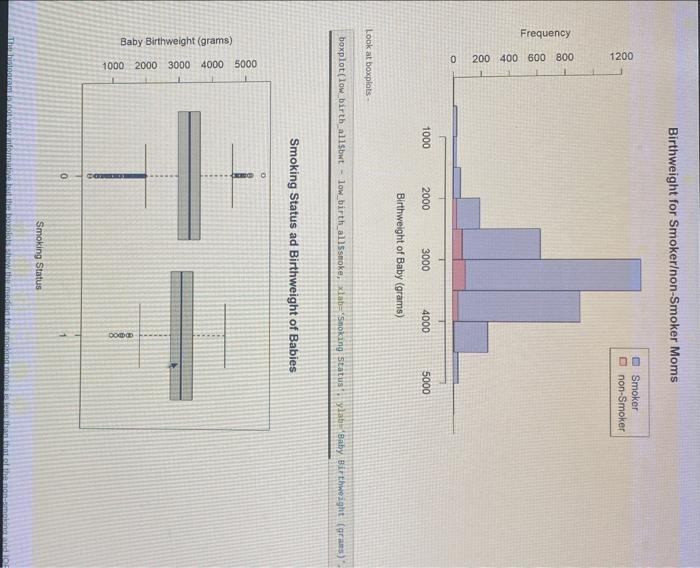
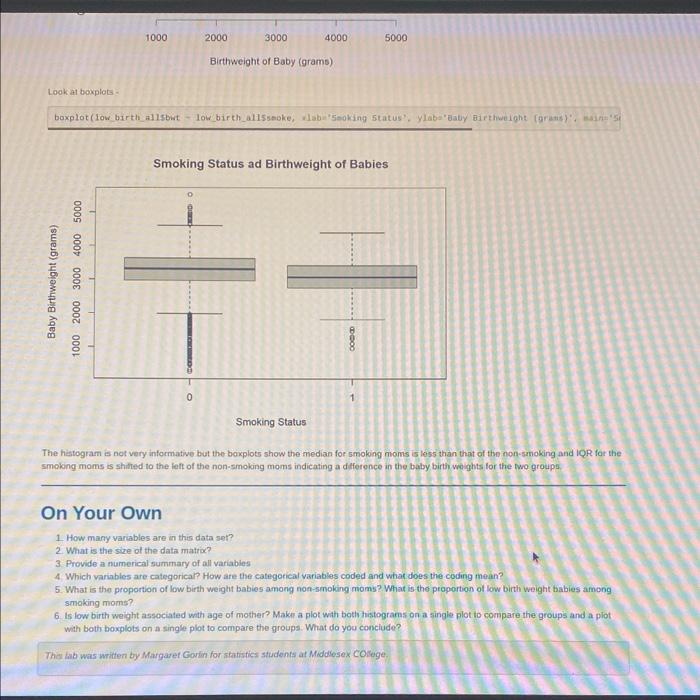
Probability-Row and Column Percents Low Birth Weight Data We will be waeking with data from bittwwights. Downiond the data lile and save to the desktop or other easy acces: Low birthualle-read.esv(file,choose(), header=T) if navigate to data file to read 2h head(lom birth_al1) an top of data. file Laid(lon birth_al1) \# botcon of dota fite Check rariwhws anded data dinenseing. How many moms ara smobors? How many babiedi are low binthweight? table(lom_birth_aldslou) 01 a 3334,337 What is the dedribution of birth weight fot sanoking momb and non-smoking moms? Mahe a tavo-wayy table of smoking staturs arid low birth i stalua tbl c- table (lok birthjalls tanake, low_birthallsiev) tbl it A. e 0.3127300 an 1 2. 207 ? What are the row and column proporions and what do they mean? prop.table(tal, 1) n Now proporfioni prop, tabje(tbl,2) e columin preportipnt babies tave aroking moms: Look at histograms and besplots io compare the smoking non-smoking grons. babies have smoknd moms. took af hriograms and bouplots to compare the smphing fi non-amoking grodipe. Make 2 groups. smekers i non-snokofs. the group of nonzokers (cmokeno) no segkec loxibirthadly [lowe birth allisnoke=0, ] I ifroin of snokera (saskent) smokes-low birth allf [low birth_altssmake w jf +) What is the burtweight range for inach group? * 411]2005530 range(sekesbut.) [1]4104400 To cambine both moto a single histogram. want min=250, maxa5500 hist (no sobkesbit, colurgb (0,0,1,0.2), x1 thic (250,30ng). hist (seakesbor, celergb (1,0,0,0,2), addergut) legend( "topright", ef "saper', "non-stoker"). fi11=c(rgb(0,0,1,0,2), irgbo (1,0,0,0,2))) Birthweight for Smokeron-Smoke Moms Birthweight for Smokerinon-Smoker Moms h_al1sbwt - low_birth_all5smoke, x tab-_snok_ng status Smoking Status ad Birthweight of Babies Smoking Status Smoking Status ad Birthweight of Babies Smoking Status The hatogram is not very informative but the boxplots show the median for smoking moms is less than that of the non-smoking and IQR for the smoking moms is shifed to the left of the non-smoking moms indicating a diference in the baby birti woights for the fro groups. On Your Own 1. How many variables are in this data set? 2. What is the size of the data matro? 3. Provide a numerical summary of all variables 4. Which variables are categorical? How are the categocical variables coded and what does the coding thean? 5. What is the proportion of low birth weight babios among non-smoking moms? What is the proporbion of low birth weight babies among smoking moms? 6. Is low birth weight associated with age of mother? Maki a plot with both histograms on a single plot to compare the groups and a plot. with both boxplots on a single plot to compare the groups. What do you conclude? Thes hab was writfen by Margazef Covlin for shanstics students af Middlesex COlege. Probability-Row and Column Percents Low Birth Weight Data We will be waeking with data from bittwwights. Downiond the data lile and save to the desktop or other easy acces: Low birthualle-read.esv(file,choose(), header=T) if navigate to data file to read 2h head(lom birth_al1) an top of data. file Laid(lon birth_al1) \# botcon of dota fite Check rariwhws anded data dinenseing. How many moms ara smobors? How many babiedi are low binthweight? table(lom_birth_aldslou) 01 a 3334,337 What is the dedribution of birth weight fot sanoking momb and non-smoking moms? Mahe a tavo-wayy table of smoking staturs arid low birth i stalua tbl c- table (lok birthjalls tanake, low_birthallsiev) tbl it A. e 0.3127300 an 1 2. 207 ? What are the row and column proporions and what do they mean? prop.table(tal, 1) n Now proporfioni prop, tabje(tbl,2) e columin preportipnt babies tave aroking moms: Look at histograms and besplots io compare the smoking non-smoking grons. babies have smoknd moms. took af hriograms and bouplots to compare the smphing fi non-amoking grodipe. Make 2 groups. smekers i non-snokofs. the group of nonzokers (cmokeno) no segkec loxibirthadly [lowe birth allisnoke=0, ] I ifroin of snokera (saskent) smokes-low birth allf [low birth_altssmake w jf +) What is the burtweight range for inach group? * 411]2005530 range(sekesbut.) [1]4104400 To cambine both moto a single histogram. want min=250, maxa5500 hist (no sobkesbit, colurgb (0,0,1,0.2), x1 thic (250,30ng). hist (seakesbor, celergb (1,0,0,0,2), addergut) legend( "topright", ef "saper', "non-stoker"). fi11=c(rgb(0,0,1,0,2), irgbo (1,0,0,0,2))) Birthweight for Smokeron-Smoke Moms Birthweight for Smokerinon-Smoker Moms h_al1sbwt - low_birth_all5smoke, x tab-_snok_ng status Smoking Status ad Birthweight of Babies Smoking Status Smoking Status ad Birthweight of Babies Smoking Status The hatogram is not very informative but the boxplots show the median for smoking moms is less than that of the non-smoking and IQR for the smoking moms is shifed to the left of the non-smoking moms indicating a diference in the baby birti woights for the fro groups. On Your Own 1. How many variables are in this data set? 2. What is the size of the data matro? 3. Provide a numerical summary of all variables 4. Which variables are categorical? How are the categocical variables coded and what does the coding thean? 5. What is the proportion of low birth weight babios among non-smoking moms? What is the proporbion of low birth weight babies among smoking moms? 6. Is low birth weight associated with age of mother? Maki a plot with both histograms on a single plot to compare the groups and a plot. with both boxplots on a single plot to compare the groups. What do you conclude? Thes hab was writfen by Margazef Covlin for shanstics students af Middlesex COlege 


Step by Step Solution
There are 3 Steps involved in it
Step: 1

Get Instant Access to Expert-Tailored Solutions
See step-by-step solutions with expert insights and AI powered tools for academic success
Step: 2

Step: 3

Ace Your Homework with AI
Get the answers you need in no time with our AI-driven, step-by-step assistance
Get Started


