Answered step by step
Verified Expert Solution
Link Copied!

Question

1 Approved Answer

HELP PLEASE PSYC 2317 Mark W. Tengler, M.S. Assignment #14 One Way Anova F Test 14.1 Describe the similarities and differences between an F-ratio and

HELP PLEASE
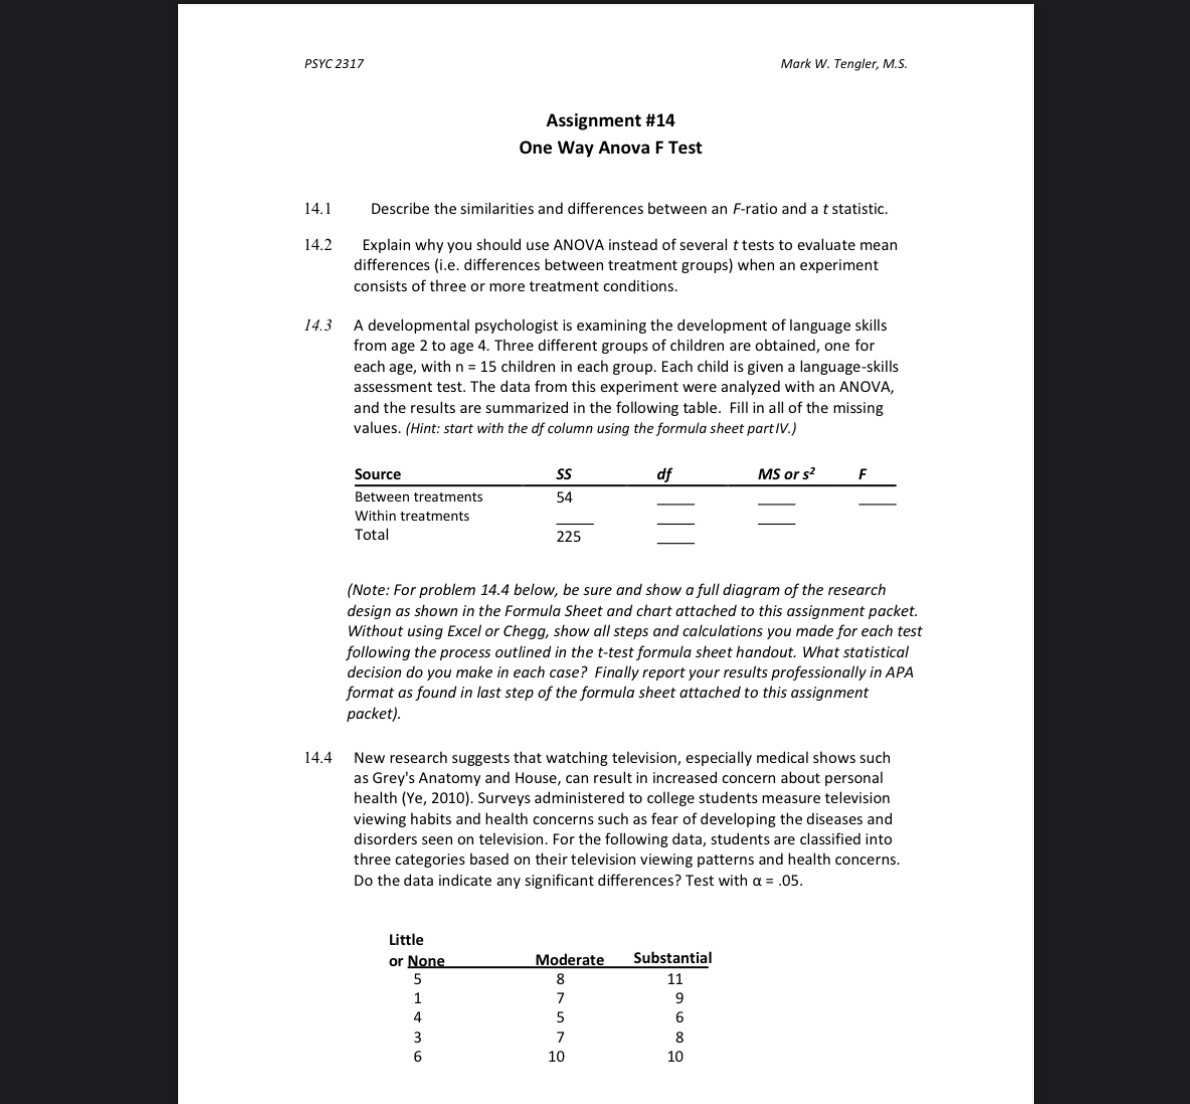
image text in transcribed
PSYC 2317 Mark W. Tengler, M.S. Assignment #14 One Way Anova F Test 14.1 Describe the similarities and differences between an F-ratio and a t statistic. 14.2 Explain why you should use ANOVA instead of several t tests to evaluate mean differences (i.e. differences between treatment groups) when an experiment consists of three or more treatment conditions. 14.3 A developmental psychologist is examining the development of language skills from age 2 to age 4. Three different groups of children are obtained, one for each age, with n = 15 children in each group. Each child is given a language-skills assessment test. The data from this experiment were analyzed with an ANOVA, and the results are summarized in the following table. Fill in all of the missing values. (Hint: start with the of column using the formula sheet part IV.) Source SS of MS or s2 Between treatments 54 Within treatments Total 225 (Note: For problem 14.4 below, be sure and show a full diagram of the research design as shown in the Formula Sheet and chart attached to this assignment packet. Without using Excel or Chegg, show all steps and calculations you made for each test following the process outlined in the t-test formula sheet handout. What statistical decision do you make in each case? Finally report your results professionally in APA format as found in last step of the formula sheet attached to this assignment packet). New research suggests that watching television, especially medical shows such as Grey's Anatomy and House, can result in increased concern about personal health (Ye, 2010). Surveys administered to college students measure television viewing habits and health concerns such as fear of developing the diseases and disorders seen on television. For the following data, students are classified into three categories based on their television viewing patterns and health concerns. Do the data indicate any significant differences? Test with a = .05. Little or None Moderate Substantial 5 5 00 on 6 1

Step by Step Solution

There are 3 Steps involved in it

Step: 1

blur-text-image

Get Instant Access to Expert-Tailored Solutions

See step-by-step solutions with expert insights and AI powered tools for academic success

Step: 2

blur-text-image

Step: 3

blur-text-image

Ace Your Homework with AI

Get the answers you need in no time with our AI-driven, step-by-step assistance

Get Started

Recommended Textbook for

Algebra And Trigonometry, Enhanced

Authors: Cynthia Y Young

4th Edition

1119320860, 9781119320869

More Books

Students also viewed these Mathematics questions