questions 4-10. let me know if the upload didnt work again.

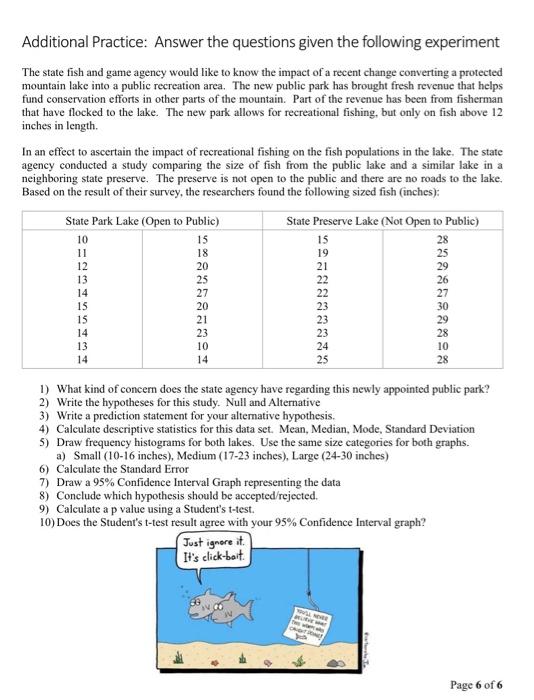
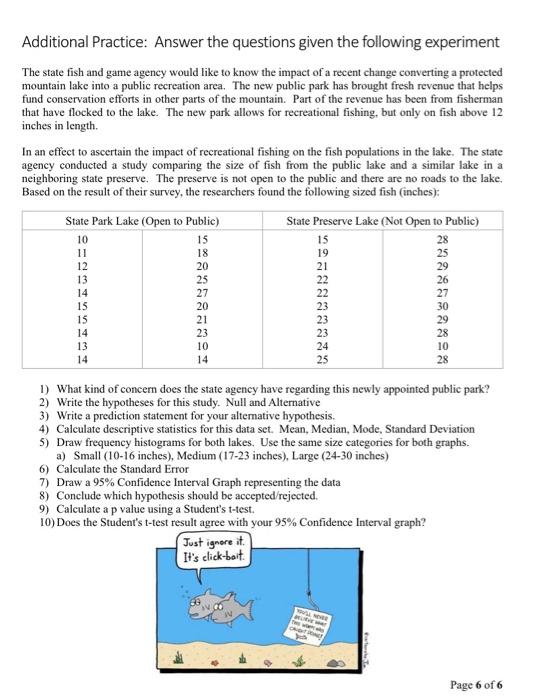
Additional Practice: Answer the questions given the following experiment The state fish and game agency would like to know the impact of a recent change converting a protected mountain lake into a public recreation area. The new public park has brought fresh revenue that helps fund conservation efforts in other parts of the mountain. Part of the revenue has been from fisherman that have flocked to the lake. The new park allows for recreational fishing, but only on fish above 12 inches in length. In an effect to ascertain the impact of recreational fishing on the fish populations in the lake. The state agency conducted a study comparing the size of fish from the public lake and a similar lake in a neighboring state preserve. The preserve is not open to the public and there are no roads to the lake. Based on the result of their survey, the researchers found the following sized fish (inches): State Park Lake (Open to Public) State Preserve Lake (Not Open to Public) 10 15 15 28 11 18 19 25 12 20 21 29 13 25 22 26 14 27 22 27 15 20 23 30 15 21 23 29 14 23 23 28 13 10 24 10 14 14 25 28 1) What kind of concern does the state agency have regarding this newly appointed public park? 2) Write the hypotheses for this study. Null and Alternative 3) Write a prediction statement for your alternative hypothesis. 4) Calculate descriptive statistics for this data set. Mean, Median, Mode, Standard Deviation 5) Draw frequency histograms for both lakes. Use the same size categories for both graphs. a) Small (10-16 inches), Medium (17-23 inches), Large (24-30 inches) 6) Calculate the Standard Error 7) Draw a 95% Confidence Interval Graph representing the data 8) Conclude which hypothesis should be accepted/rejected. 9) Calculate a p value using a Student's t-test. 10) Does the Student's t-test result agree with your 95% Confidence Interval graph? Just ignore it. It's click-bait YOU'LL NEVER WAY CAUGNT ONLY Page 6 of 6 Additional Practice: Answer the questions given the following experiment The state fish and game agency would like to know the impact of a recent change converting a protected mountain lake into a public recreation area. The new public park has brought fresh revenue that helps fund conservation efforts in other parts of the mountain. Part of the revenue has been from fisherman that have flocked to the lake. The new park allows for recreational fishing, but only on fish above 12 inches in length. In an effect to ascertain the impact of recreational fishing on the fish populations in the lake. The state agency conducted a study comparing the size of fish from the public lake and a similar lake in a neighboring state preserve. The preserve is not open to the public and there are no roads to the lake. Based on the result of their survey, the researchers found the following sized fish (inches): State Park Lake (Open to Public) State Preserve Lake (Not Open to Public) 10 15 15 28 11 18 19 25 12 20 21 29 13 25 22 26 14 27 22 27 15 20 23 30 15 21 23 29 14 23 23 28 13 10 24 10 14 14 25 28 1) What kind of concern does the state agency have regarding this newly appointed public park? 2) Write the hypotheses for this study. Null and Alternative 3) Write a prediction statement for your alternative hypothesis. 4) Calculate descriptive statistics for this data set. Mean, Median, Mode, Standard Deviation 5) Draw frequency histograms for both lakes. Use the same size categories for both graphs. a) Small (10-16 inches), Medium (17-23 inches), Large (24-30 inches) 6) Calculate the Standard Error 7) Draw a 95% Confidence Interval Graph representing the data 8) Conclude which hypothesis should be accepted/rejected. 9) Calculate a p value using a Student's t-test. 10) Does the Student's t-test result agree with your 95% Confidence Interval graph? Just ignore it. It's click-bait YOU'LL NEVER WAY CAUGNT ONLY Page 6 of 6 Additional Practice: Answer the questions given the following experiment The state fish and game agency would like to know the impact of a recent change converting a protected mountain lake into a public recreation area. The new public park has brought fresh revenue that helps fund conservation efforts in other parts of the mountain. Part of the revenue has been from fisherman that have flocked to the lake. The new park allows for recreational fishing, but only on fish above 12 inches in length. In an effect to ascertain the impact of recreational fishing on the fish populations in the lake. The state agency conducted a study comparing the size of fish from the public lake and a similar lake in a neighboring state preserve. The preserve is not open to the public and there are no roads to the lake. Based on the result of their survey, the researchers found the following sized fish (inches): State Park Lake (Open to Public) State Preserve Lake (Not Open to Public) 10 15 15 28 11 18 19 25 12 20 21 29 13 25 22 26 14 27 22 27 15 20 23 30 15 21 23 29 14 23 23 28 13 10 24 10 14 14 25 28 1) What kind of concern does the state agency have regarding this newly appointed public park? 2) Write the hypotheses for this study. Null and Alternative 3) Write a prediction statement for your alternative hypothesis. 4) Calculate descriptive statistics for this data set. Mean, Median, Mode, Standard Deviation 5) Draw frequency histograms for both lakes. Use the same size categories for both graphs. a) Small (10-16 inches), Medium (17-23 inches), Large (24-30 inches) 6) Calculate the Standard Error 7) Draw a 95% Confidence Interval Graph representing the data 8) Conclude which hypothesis should be accepted/rejected. 9) Calculate a p value using a Student's t-test. 10) Does the Student's t-test result agree with your 95% Confidence Interval graph? Just ignore it. It's click-bait YOU'LL NEVER WAY CAUGNT ONLY Page 6 of 6 Additional Practice: Answer the questions given the following experiment The state fish and game agency would like to know the impact of a recent change converting a protected mountain lake into a public recreation area. The new public park has brought fresh revenue that helps fund conservation efforts in other parts of the mountain. Part of the revenue has been from fisherman that have flocked to the lake. The new park allows for recreational fishing, but only on fish above 12 inches in length. In an effect to ascertain the impact of recreational fishing on the fish populations in the lake. The state agency conducted a study comparing the size of fish from the public lake and a similar lake in a neighboring state preserve. The preserve is not open to the public and there are no roads to the lake. Based on the result of their survey, the researchers found the following sized fish (inches): State Park Lake (Open to Public) State Preserve Lake (Not Open to Public) 10 15 15 28 11 18 19 25 12 20 21 29 13 25 22 26 14 27 22 27 15 20 23 30 15 21 23 29 14 23 23 28 13 10 24 10 14 14 25 28 1) What kind of concern does the state agency have regarding this newly appointed public park? 2) Write the hypotheses for this study. Null and Alternative 3) Write a prediction statement for your alternative hypothesis. 4) Calculate descriptive statistics for this data set. Mean, Median, Mode, Standard Deviation 5) Draw frequency histograms for both lakes. Use the same size categories for both graphs. a) Small (10-16 inches), Medium (17-23 inches), Large (24-30 inches) 6) Calculate the Standard Error 7) Draw a 95% Confidence Interval Graph representing the data 8) Conclude which hypothesis should be accepted/rejected. 9) Calculate a p value using a Student's t-test. 10) Does the Student's t-test result agree with your 95% Confidence Interval graph? Just ignore it. It's click-bait YOU'LL NEVER WAY CAUGNT ONLY Page 6 of 6


