Help solve
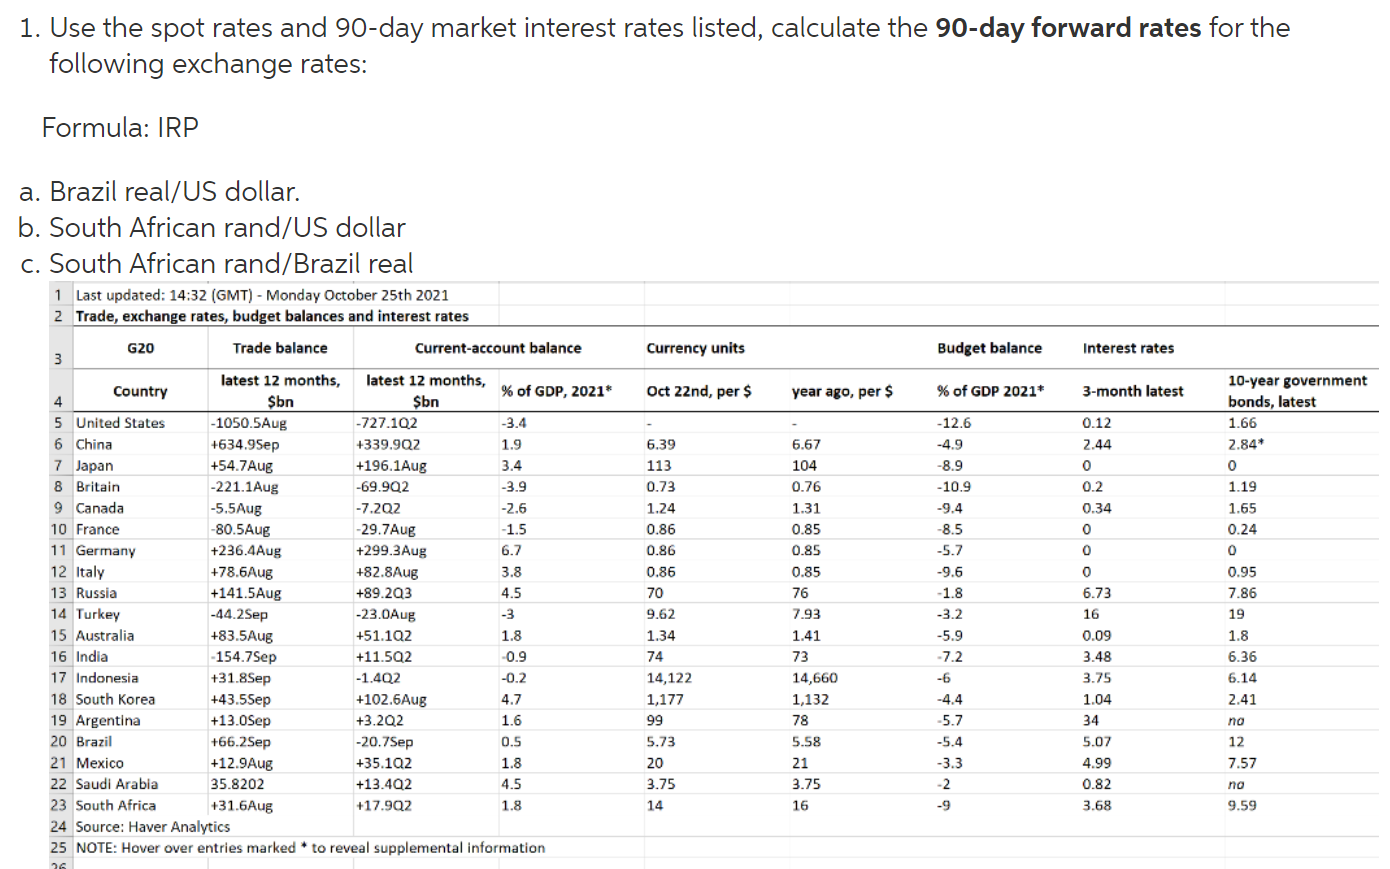
1. Use the spot rates and 90-day market interest rates listed, calculate the 90-day forward rates for the following exchange rates: Formula: IRP a. Brazil real/US dollar. b. South African rand/US dollar c. South African rand/Brazil real 1 Last updated: 14:32 (GMT) - Monday October 25th 2021 2 Trade, exchange rates, budget balances and interest rates Currency units Budget balance Interest rates Oct 22nd, per $ year ago, per $ % of GDP 2021* 3-month latest - 12.6 6.67 104 0.76 6.39 113 0.73 1.24 0.86 0.86 0.86 0.12 2.44 0 0.2 0.34 0 10-year government bonds, latest 1.66 2.840 0 1.19 1.65 0.24 0 0.95 7.86 1.31 0 0 6.73 G20 Trade balance Current-account balance 3 latest 12 months, latest 12 months, Country % of GDP, 2021* 4 $bn Sbn 5 United States -1050.5Aug -727.102 -3.4 6 China +634.95ep +339.902 1.9 7 Japan +54.7Aug +196.1Aug 3.4 8 Britain -221.1 Aug -69.902 -3.9 9 Canada -5.5Aug -7.202 -2.6 10 France -80.5Aug -29.7Aug -1.5 11 Germany +236.4Aug +299.3Aug 6.7 12 Italy +78.6Aug +82.8Aug 3.8 13 Russia +141.5Aug +89.293 4.5 14 Turkey -44.2 Sep -23.0Aug -3 15 Australia +83.5Aug +51.102 1.8 16 India -154.7 Sep +11.592 -0.9 17 Indonesia +31.8 Sep -1.402 -0.2 18 South Korea +43.55ep +102.6Aug 4.7 19 Argentina +13.0Sep +3.202 1.6 20 Brazil +66.2Sep -20.7Sep 0.5 21 Mexico +12.9Aug +35.192 1.8 22 Saudi Arabia 35.8202 +13.492 4.5 23 South Africa +31.6Aug +17.902 1.8 24 Source: Haver Analytics 25 NOTE: Hover over entries marked to reveal supplemental information 26 70 9.62 16 19 -4.9 -8.9 -10.9 -9.4 -8.5 -5.7 -9.6 -1.8 -3.2 -5.9 -7.2 -6 -4.4 -5.7 -5.4 -3.3 -2 -9 0.85 0.85 0.85 76 7.93 1.41 73 14,660 1,132 78 5.58 21 3.75 1.34 74 0.09 3.48 3.75 1.04 1.8 6.36 6.14 2.41 no 14,122 1,177 99 5.73 20 3.75 14 34 5.07 12 7.57 4.99 0.82 3.68 no 16 9.59 nil Aug 2 Output, prices and unemployment Gross domestic product, % change on a Industrial production, % G20 3 year ago change on a year ago 4 Country latest quarter* 2021* 2022* latest 5 United States +12.202 6.7 6 3.7 +4.6Sep 6 China +4.9Q3 0.8 7.9 5.3 +3.1 Sep 7 Japan +7.602 1.9 2.3 3 +8.8Aug 8 Britain +23.602 23.9 6.4 4.1 +3.7Aug 9 Canada +12.702 - 1.1 5.4 3.6 +4.5Jul 10 France +18.702 4.5 6.1 4 +3.9 Aug 11 Germany +9.402 6.7 3.1 4.2 +1.6Aug 12 Italy +17.202 11.2 6 4.4 13 Russia +10.502 na 3.8 2.7 +4.7Aug 14 Turkey +21.702 na 8 3.3 +19.9Aug 15 Australia +9.602 2.7 4.2 2.2 +0.902 16 India +20.102 -41.2 8.2 7.8 +11.9Aug 17 Indonesia +7.102 na 3 5 +0.4Mar 18 South Korea +6.002 3.1 4 2.8 +9.6Aug 19 Argentina +17.902 -5.5 8.1 2.7 +11.6Aug 20 Brazil +12.402 -0.2 5 1.2 -0.6Aug 21 Mexico +19.602 6 6.4 2.7 +5.5 Aug 22 Saudi Arabia -4.1202 na 2.2 3.6 na 23 South Africa +19.302 4.7 4.5 2.4 +0.7Aug 24 Source: Haver Analytics 25 NOTE: Hover over entries marked * to reveal supplemental information Consumer prices % change on a Unemployment year ago rate, % latest year ago 2021* latest +5.45ep 1.4 4.3 4.85ep +0.7 Sep 1.7 1 4.9Sep* +0.2Sep -0.2 -0.2 2.8Aug +3.1 Sep 0.5 2.8 4.5Jul* +4.4Sep 0.5 3 6.9Sep +2.2 Sep 0 1.9 8.0Aug +4.1 Sep -0.2 2.5 3.6Aug +2.55ep -0.6 1.6 9.3Aug +7.45ep 4.4Aug* +19.6Sep 11.7 17.1 12.0Aug* +3.802 -0.3 2.4 4.6Sep +4.3Sep 7.3 5.4 6.9Sep +1.6Sep 1.7 6.3Q1* +2.5 Sep 1 2.2 2.7 Sep* +52.5Sep na 47.3 9.602* +10.2Sep 3.1 8 13.7Jul* +6.0Sep 4 5.3 3.9Sep +0.7Sep 5.7 3.1 6.602 +5.1Sep 2.9 4.4 34.4Q2* 3.7 5.9 1.4 1. Use the spot rates and 90-day market interest rates listed, calculate the 90-day forward rates for the following exchange rates: Formula: IRP a. Brazil real/US dollar. b. South African rand/US dollar c. South African rand/Brazil real 1 Last updated: 14:32 (GMT) - Monday October 25th 2021 2 Trade, exchange rates, budget balances and interest rates Currency units Budget balance Interest rates Oct 22nd, per $ year ago, per $ % of GDP 2021* 3-month latest - 12.6 6.67 104 0.76 6.39 113 0.73 1.24 0.86 0.86 0.86 0.12 2.44 0 0.2 0.34 0 10-year government bonds, latest 1.66 2.840 0 1.19 1.65 0.24 0 0.95 7.86 1.31 0 0 6.73 G20 Trade balance Current-account balance 3 latest 12 months, latest 12 months, Country % of GDP, 2021* 4 $bn Sbn 5 United States -1050.5Aug -727.102 -3.4 6 China +634.95ep +339.902 1.9 7 Japan +54.7Aug +196.1Aug 3.4 8 Britain -221.1 Aug -69.902 -3.9 9 Canada -5.5Aug -7.202 -2.6 10 France -80.5Aug -29.7Aug -1.5 11 Germany +236.4Aug +299.3Aug 6.7 12 Italy +78.6Aug +82.8Aug 3.8 13 Russia +141.5Aug +89.293 4.5 14 Turkey -44.2 Sep -23.0Aug -3 15 Australia +83.5Aug +51.102 1.8 16 India -154.7 Sep +11.592 -0.9 17 Indonesia +31.8 Sep -1.402 -0.2 18 South Korea +43.55ep +102.6Aug 4.7 19 Argentina +13.0Sep +3.202 1.6 20 Brazil +66.2Sep -20.7Sep 0.5 21 Mexico +12.9Aug +35.192 1.8 22 Saudi Arabia 35.8202 +13.492 4.5 23 South Africa +31.6Aug +17.902 1.8 24 Source: Haver Analytics 25 NOTE: Hover over entries marked to reveal supplemental information 26 70 9.62 16 19 -4.9 -8.9 -10.9 -9.4 -8.5 -5.7 -9.6 -1.8 -3.2 -5.9 -7.2 -6 -4.4 -5.7 -5.4 -3.3 -2 -9 0.85 0.85 0.85 76 7.93 1.41 73 14,660 1,132 78 5.58 21 3.75 1.34 74 0.09 3.48 3.75 1.04 1.8 6.36 6.14 2.41 no 14,122 1,177 99 5.73 20 3.75 14 34 5.07 12 7.57 4.99 0.82 3.68 no 16 9.59 nil Aug 2 Output, prices and unemployment Gross domestic product, % change on a Industrial production, % G20 3 year ago change on a year ago 4 Country latest quarter* 2021* 2022* latest 5 United States +12.202 6.7 6 3.7 +4.6Sep 6 China +4.9Q3 0.8 7.9 5.3 +3.1 Sep 7 Japan +7.602 1.9 2.3 3 +8.8Aug 8 Britain +23.602 23.9 6.4 4.1 +3.7Aug 9 Canada +12.702 - 1.1 5.4 3.6 +4.5Jul 10 France +18.702 4.5 6.1 4 +3.9 Aug 11 Germany +9.402 6.7 3.1 4.2 +1.6Aug 12 Italy +17.202 11.2 6 4.4 13 Russia +10.502 na 3.8 2.7 +4.7Aug 14 Turkey +21.702 na 8 3.3 +19.9Aug 15 Australia +9.602 2.7 4.2 2.2 +0.902 16 India +20.102 -41.2 8.2 7.8 +11.9Aug 17 Indonesia +7.102 na 3 5 +0.4Mar 18 South Korea +6.002 3.1 4 2.8 +9.6Aug 19 Argentina +17.902 -5.5 8.1 2.7 +11.6Aug 20 Brazil +12.402 -0.2 5 1.2 -0.6Aug 21 Mexico +19.602 6 6.4 2.7 +5.5 Aug 22 Saudi Arabia -4.1202 na 2.2 3.6 na 23 South Africa +19.302 4.7 4.5 2.4 +0.7Aug 24 Source: Haver Analytics 25 NOTE: Hover over entries marked * to reveal supplemental information Consumer prices % change on a Unemployment year ago rate, % latest year ago 2021* latest +5.45ep 1.4 4.3 4.85ep +0.7 Sep 1.7 1 4.9Sep* +0.2Sep -0.2 -0.2 2.8Aug +3.1 Sep 0.5 2.8 4.5Jul* +4.4Sep 0.5 3 6.9Sep +2.2 Sep 0 1.9 8.0Aug +4.1 Sep -0.2 2.5 3.6Aug +2.55ep -0.6 1.6 9.3Aug +7.45ep 4.4Aug* +19.6Sep 11.7 17.1 12.0Aug* +3.802 -0.3 2.4 4.6Sep +4.3Sep 7.3 5.4 6.9Sep +1.6Sep 1.7 6.3Q1* +2.5 Sep 1 2.2 2.7 Sep* +52.5Sep na 47.3 9.602* +10.2Sep 3.1 8 13.7Jul* +6.0Sep 4 5.3 3.9Sep +0.7Sep 5.7 3.1 6.602 +5.1Sep 2.9 4.4 34.4Q2* 3.7 5.9 1.4