help

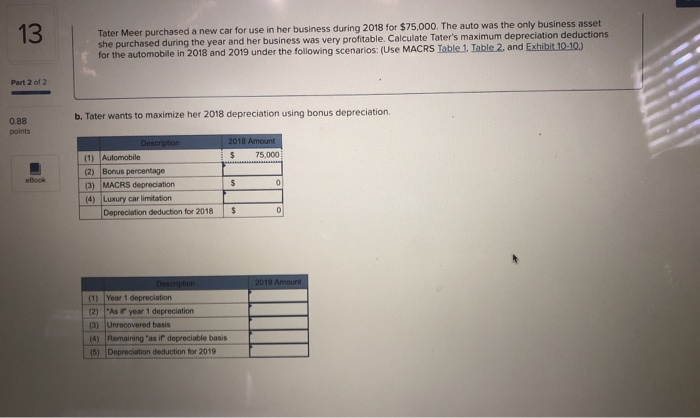
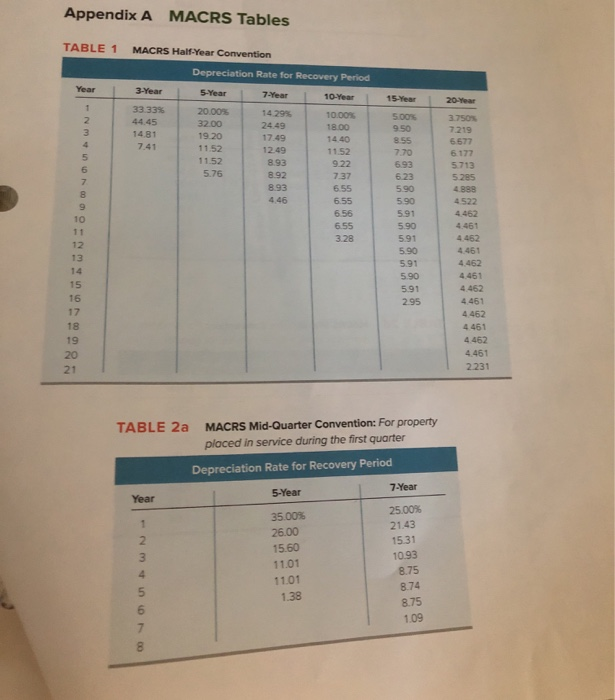
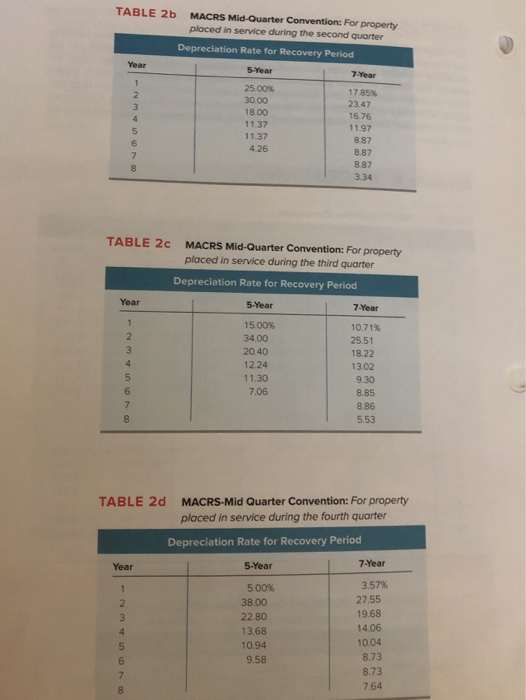
Tater Meer purchased a new car for use in her business during 2018 for $75,000. The auto was the only business asset she purchased during the year and her business was very profitable. Calculate Tater's maximum depreciation deductions for the automobile in 2018 and 2019 under the following scenarios: (Use MACRS Table 1, Table 2, and Exhibit 10-10.) 13 Part 2 of 2 b. Tater wants to maximize her 2018 depreciation using bonus depreciation. 0.88 points 2018 Amount Description 75.000 (1) Automobile (2) Bonus percentage (3) MACRS depreciation (4) Luxury car limitation eBook S C 0 Depreciation deduction for 2018 2019 Amount Description (1) Year 1 depreciation (2) As r vear 1 depreciation (3) Unrecovered basis (4) Remaining "as if depreciable basis (5) Depreciation deduction for 2019 Appendix A MACRS Tables TABLE 1 MACRS Half-Year Convention Depreciation Rate for Recovery Period Year 3-Year S-Year 7-Year 10-Year 15-Year 20-Year 1 33.33% 20.00% 14.29% 10.00% 5.00% 3.750% 2 44.45 32.00 24.49 18.00 950 7.219 14.81 19.20 17.49 8 55 14.40 6677 4 7.41 11.52 12.49 11.52 7.70 6.177 5 11.52 8.93 9.22 6.93 5713 6 5.76 8.92 7.37 6.23 5.285 7 8.93 4.888 6.55 5.90 446 6.55 5.90 4522 6.56 5.91 4.462 10 6.55 5.90 4.461 11 3.28 5.91 4.462 12 5.90 4.461 13 5.91 4.462 14 4.461 5.90 15 5.91 4.462 16 4.461 2.95 17 4.462 18 4.461 19 4.462 4.461 20 2231 21 TABLE 2a MACRS Mid-Quarter Convention: For property placed in service during the first quarter Depreciation Rate for Recovery Period 7-Year 5-Year Year 25.00% 35.00% 21.43 26.00 15.31 10.93 15.60 11.01 8.75 11.01 8.74 1.38 8.75 1.09 TABLE 2b MACRS Mid-Quarter Convention: For property placed in service during the second quarter Depreciation Rate for Recovery Period Year 5-Year 7-Year 1 25.00 % 30.00 18.00 17 85% 23.47 16.76 11.97 8.87 8.87 4 11.37 11.37 6 4.26 7 887 3.34 TABLE 2c MACRS Mid-Quarter Convention: For property placed in service during the third quarter Depreciation Rate for Recovery Period Year 5-Year 7-Year 15.00% 10.71% 2 34.00 25.51 20.40 18.22 4 12.24 13.02 5 11.30 9.30 6 7.06 8.85 7 8.86 5.53 MACRS-Mid Quarter Convention: For property placed in service during the fourth quarter TABLE 2d Depreciation Rate for Recovery Period 7-Year 5-Year Year 3.57% 5.00% 1 27.55 38.00 2 19.68 22.80 14.06 13.68 4 10.04 10.94 5 8.73 9.58 8.73 7 7.64 8 NM n oN 00 Tater Meer purchased a new car for use in her business during 2018 for $75,000. The auto was the only business asset she purchased during the year and her business was very profitable. Calculate Tater's maximum depreciation deductions for the automobile in 2018 and 2019 under the following scenarios: (Use MACRS Table 1, Table 2, and Exhibit 10-10.) 13 Part 2 of 2 b. Tater wants to maximize her 2018 depreciation using bonus depreciation. 0.88 points 2018 Amount Description 75.000 (1) Automobile (2) Bonus percentage (3) MACRS depreciation (4) Luxury car limitation eBook S C 0 Depreciation deduction for 2018 2019 Amount Description (1) Year 1 depreciation (2) As r vear 1 depreciation (3) Unrecovered basis (4) Remaining "as if depreciable basis (5) Depreciation deduction for 2019 Appendix A MACRS Tables TABLE 1 MACRS Half-Year Convention Depreciation Rate for Recovery Period Year 3-Year S-Year 7-Year 10-Year 15-Year 20-Year 1 33.33% 20.00% 14.29% 10.00% 5.00% 3.750% 2 44.45 32.00 24.49 18.00 950 7.219 14.81 19.20 17.49 8 55 14.40 6677 4 7.41 11.52 12.49 11.52 7.70 6.177 5 11.52 8.93 9.22 6.93 5713 6 5.76 8.92 7.37 6.23 5.285 7 8.93 4.888 6.55 5.90 446 6.55 5.90 4522 6.56 5.91 4.462 10 6.55 5.90 4.461 11 3.28 5.91 4.462 12 5.90 4.461 13 5.91 4.462 14 4.461 5.90 15 5.91 4.462 16 4.461 2.95 17 4.462 18 4.461 19 4.462 4.461 20 2231 21 TABLE 2a MACRS Mid-Quarter Convention: For property placed in service during the first quarter Depreciation Rate for Recovery Period 7-Year 5-Year Year 25.00% 35.00% 21.43 26.00 15.31 10.93 15.60 11.01 8.75 11.01 8.74 1.38 8.75 1.09 TABLE 2b MACRS Mid-Quarter Convention: For property placed in service during the second quarter Depreciation Rate for Recovery Period Year 5-Year 7-Year 1 25.00 % 30.00 18.00 17 85% 23.47 16.76 11.97 8.87 8.87 4 11.37 11.37 6 4.26 7 887 3.34 TABLE 2c MACRS Mid-Quarter Convention: For property placed in service during the third quarter Depreciation Rate for Recovery Period Year 5-Year 7-Year 15.00% 10.71% 2 34.00 25.51 20.40 18.22 4 12.24 13.02 5 11.30 9.30 6 7.06 8.85 7 8.86 5.53 MACRS-Mid Quarter Convention: For property placed in service during the fourth quarter TABLE 2d Depreciation Rate for Recovery Period 7-Year 5-Year Year 3.57% 5.00% 1 27.55 38.00 2 19.68 22.80 14.06 13.68 4 10.04 10.94 5 8.73 9.58 8.73 7 7.64 8 NM n oN 00


