Answered step by step
Verified Expert Solution
Question
1 Approved Answer
help this lab is due soon and I don't know what to do Problem 2: you need to write a function that accepts two lists
help this lab is due soon and I don't know what to do
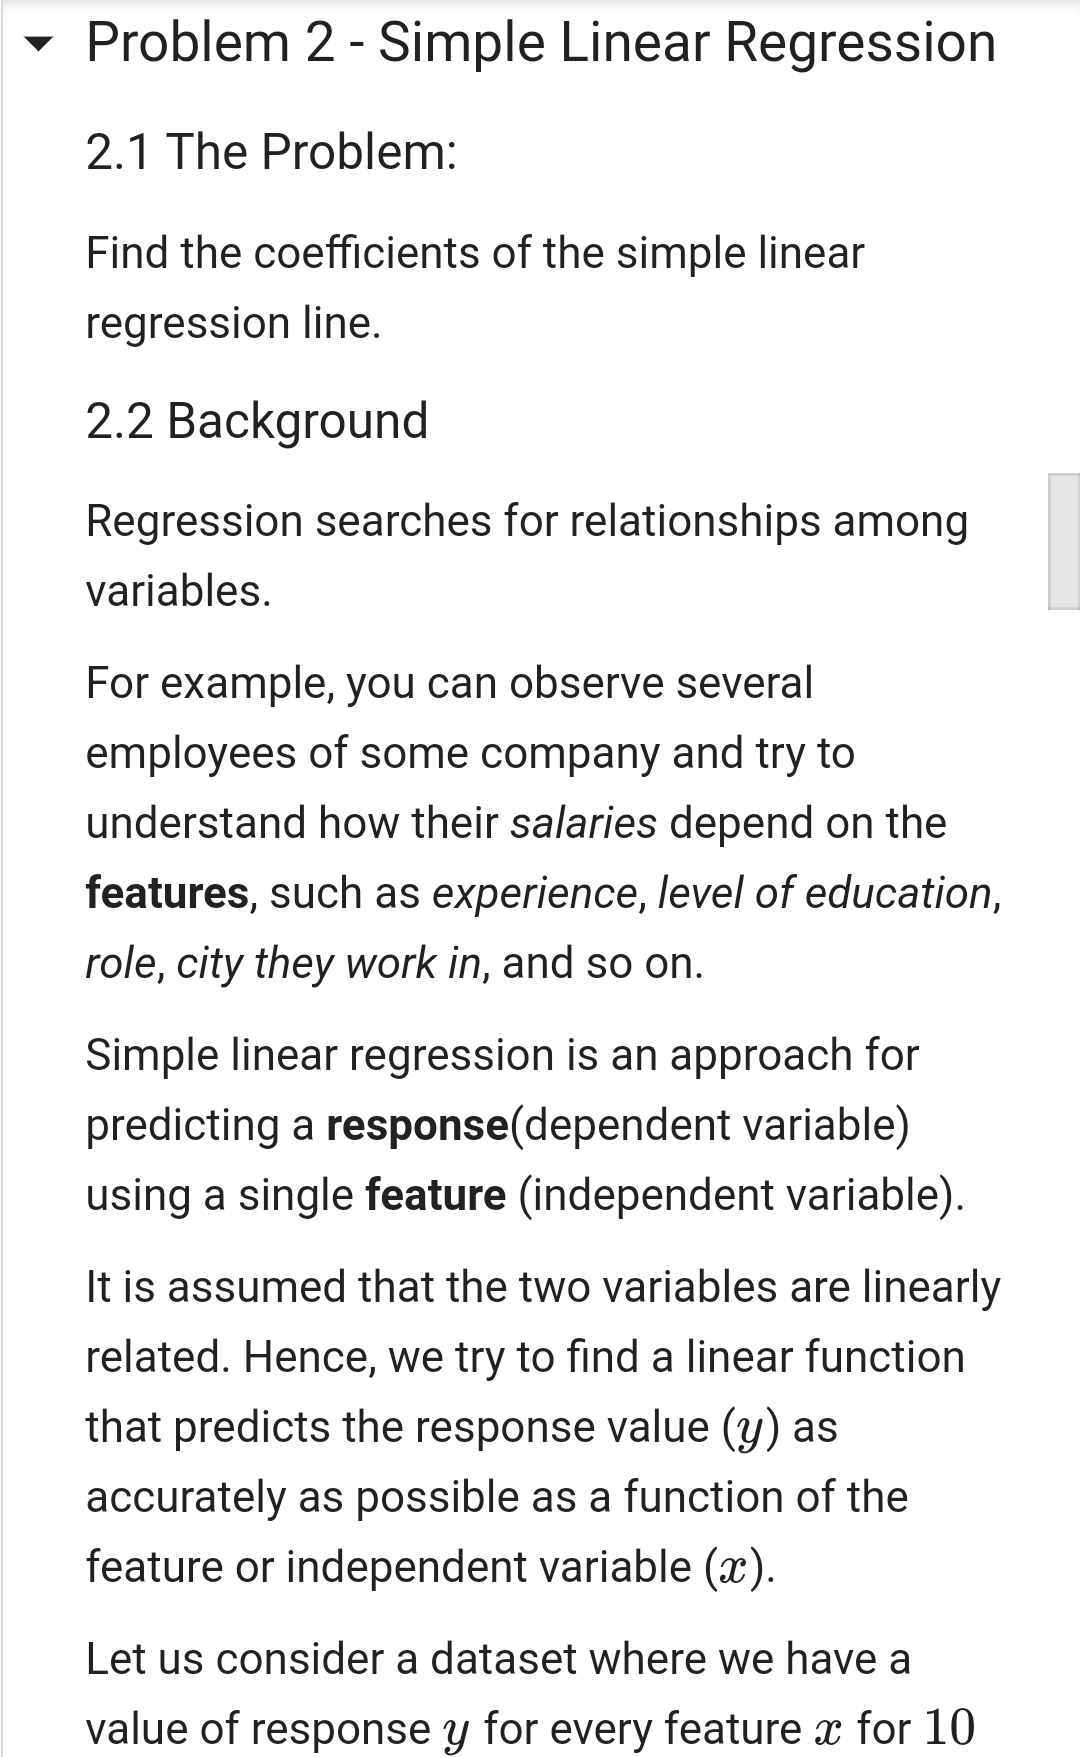
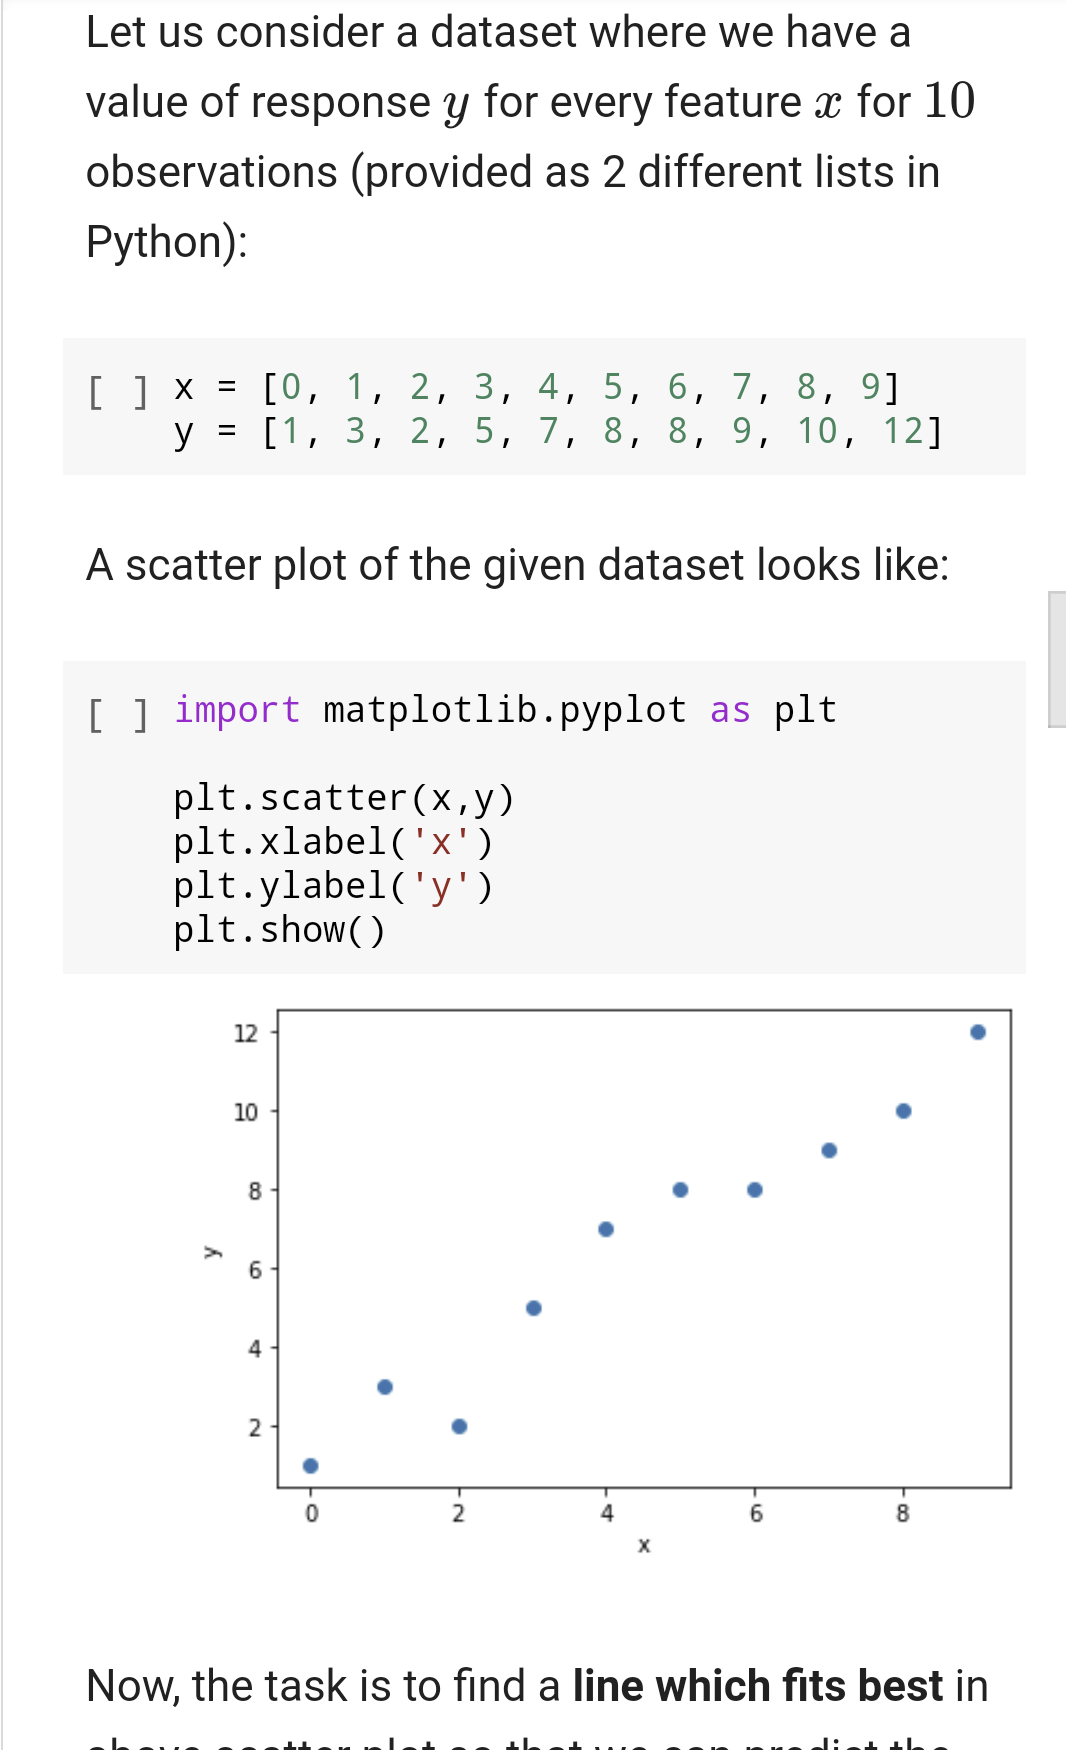
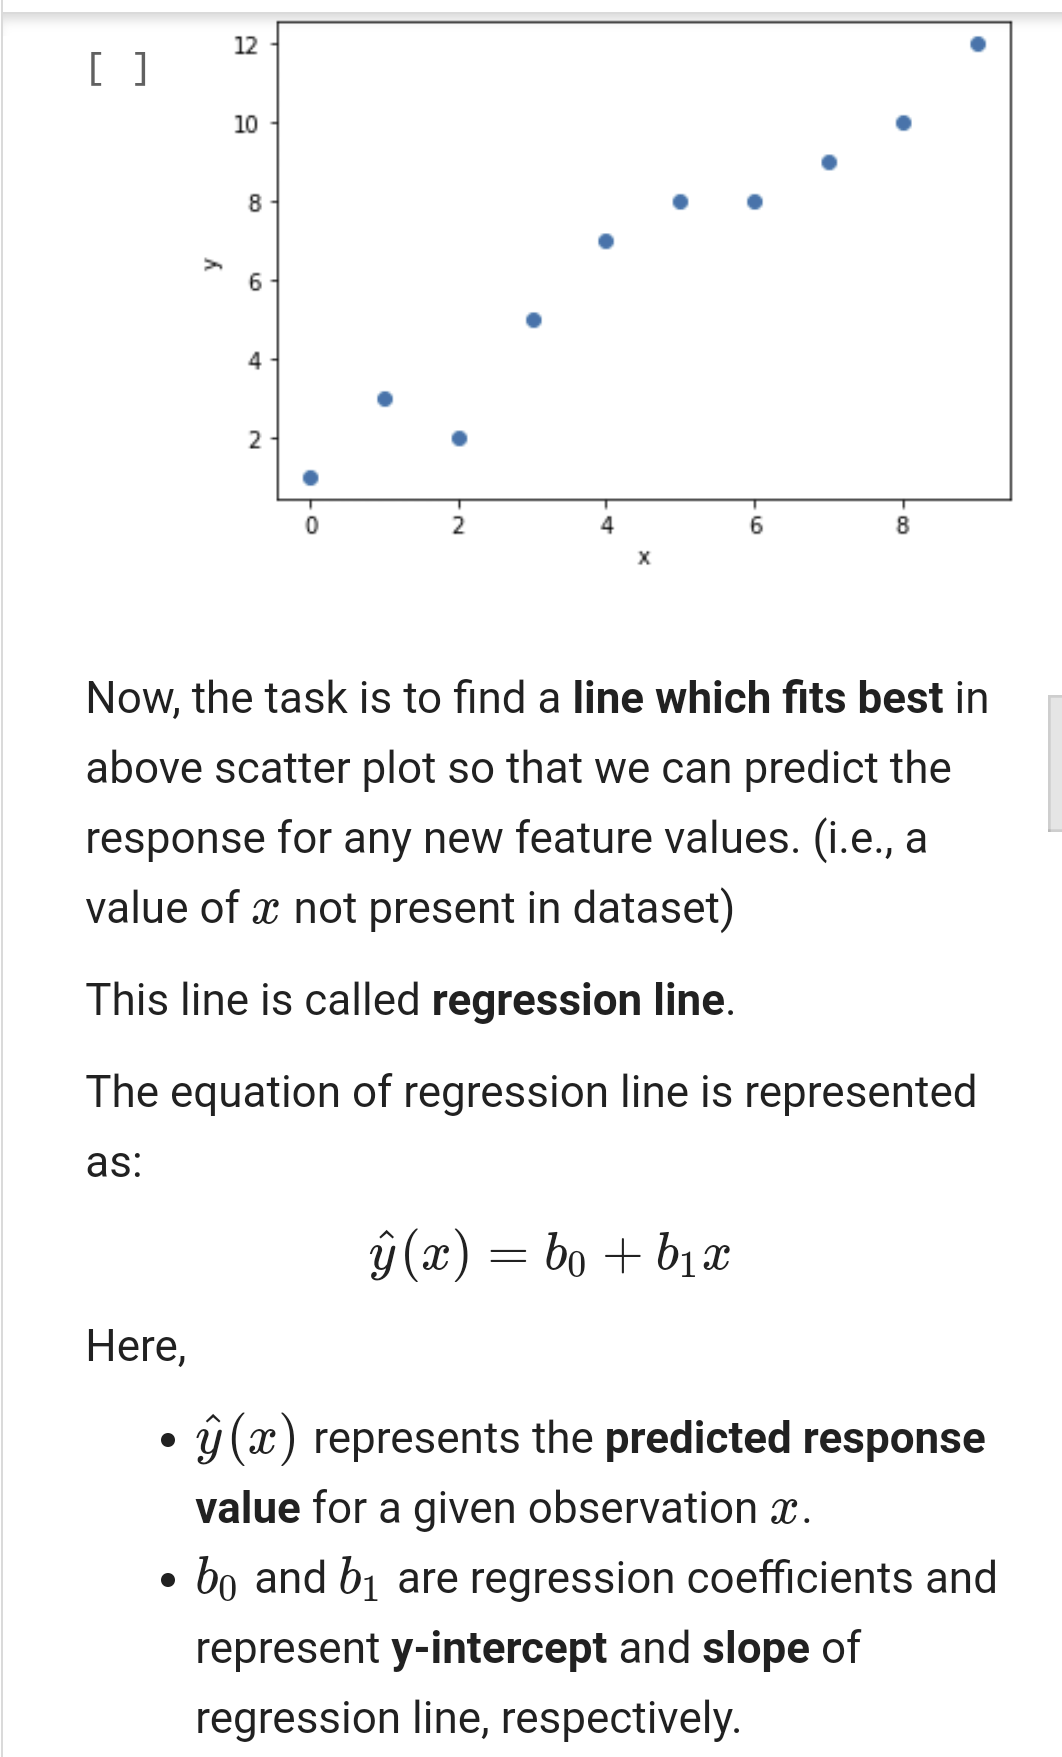
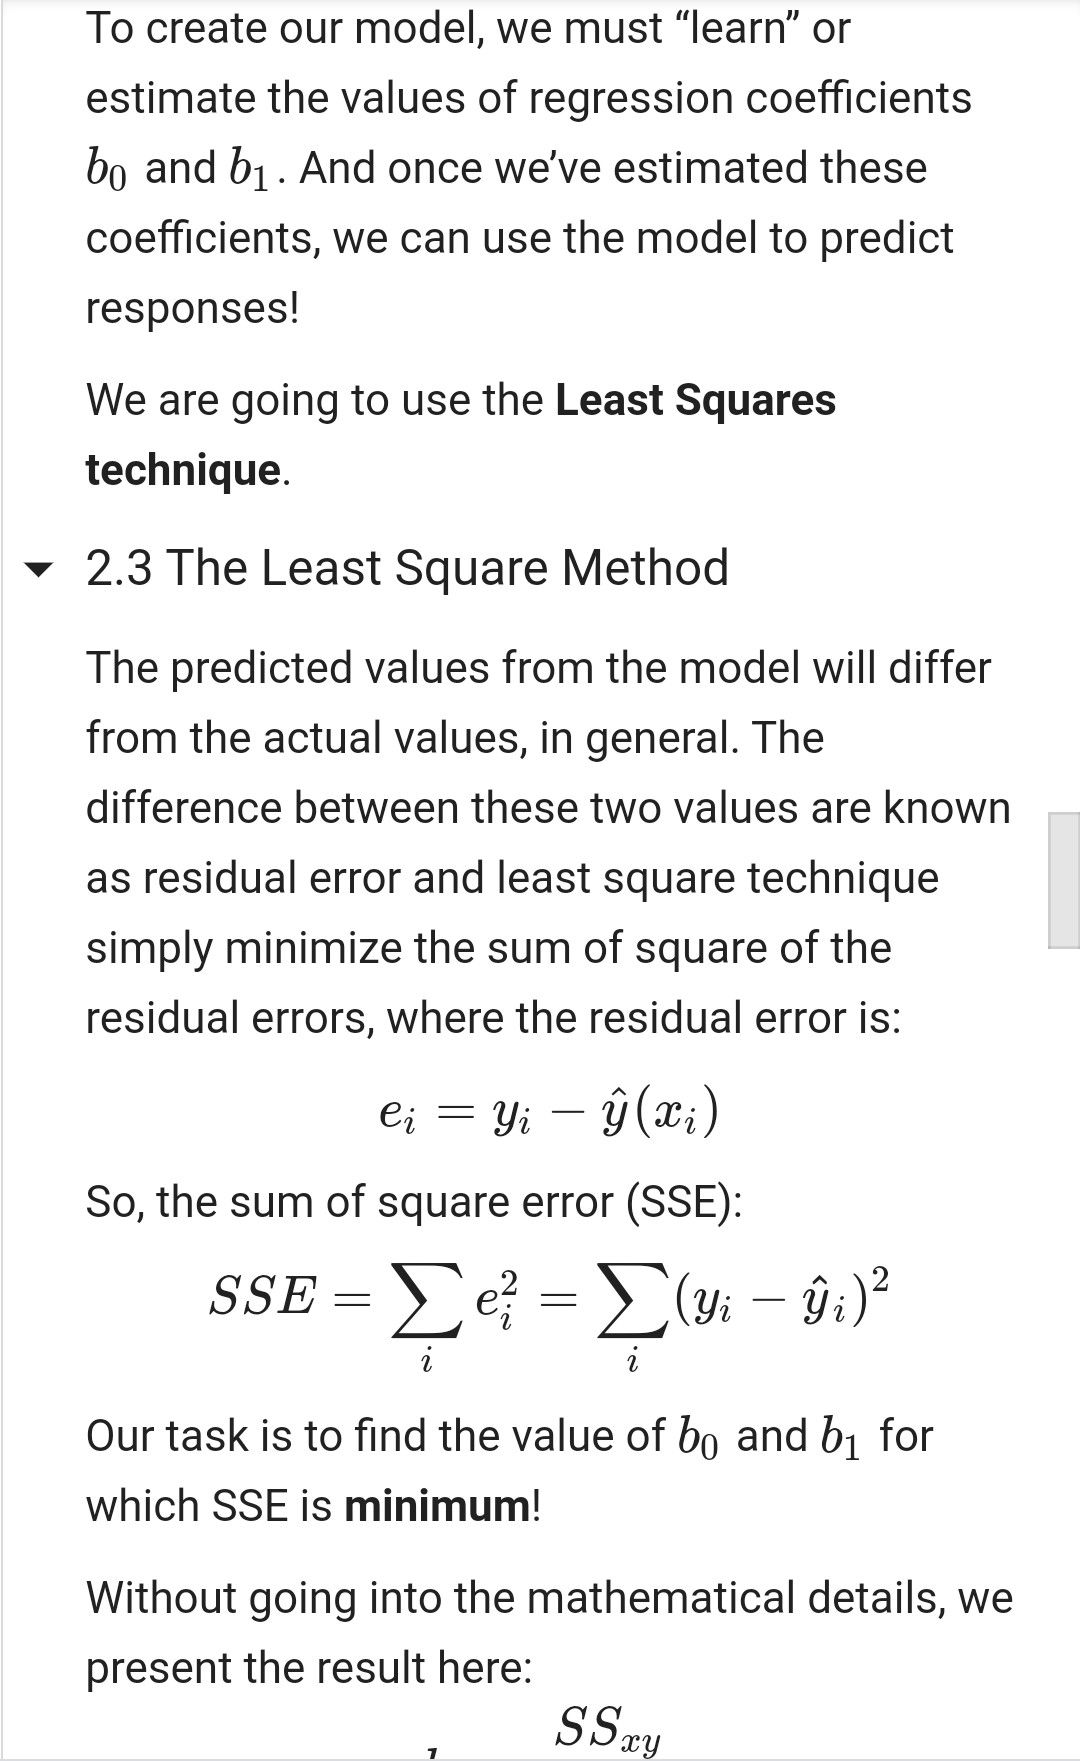
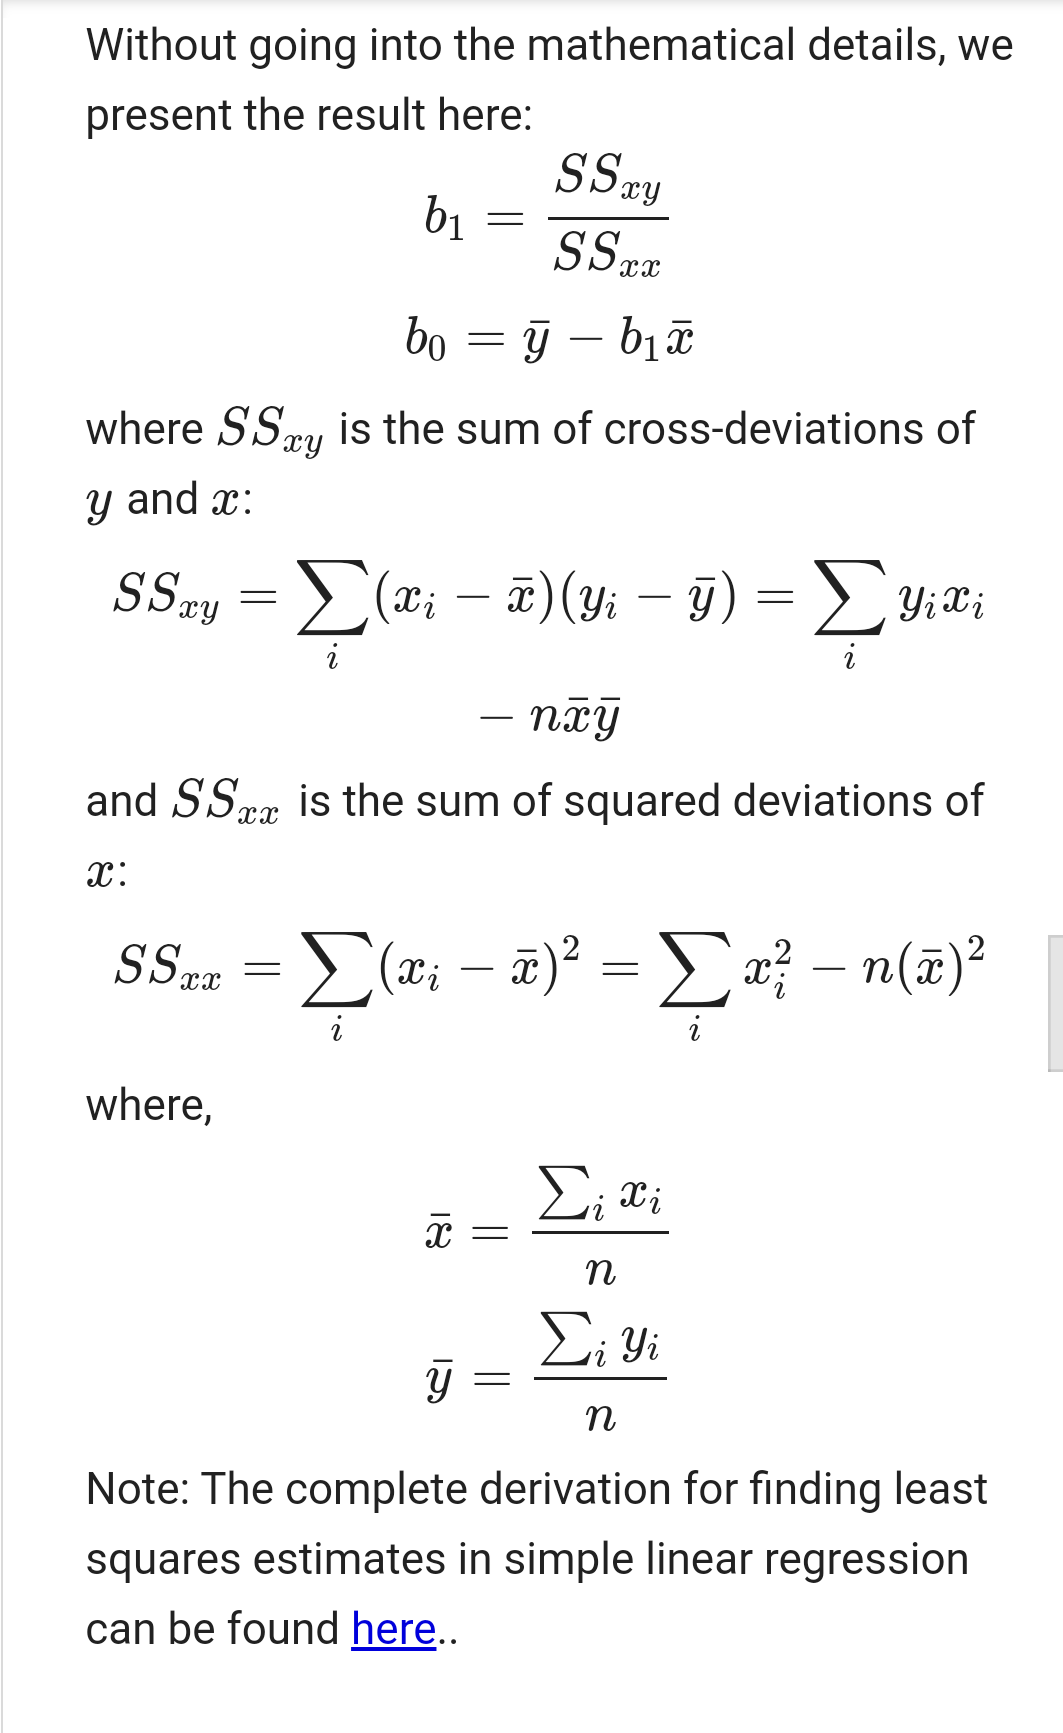
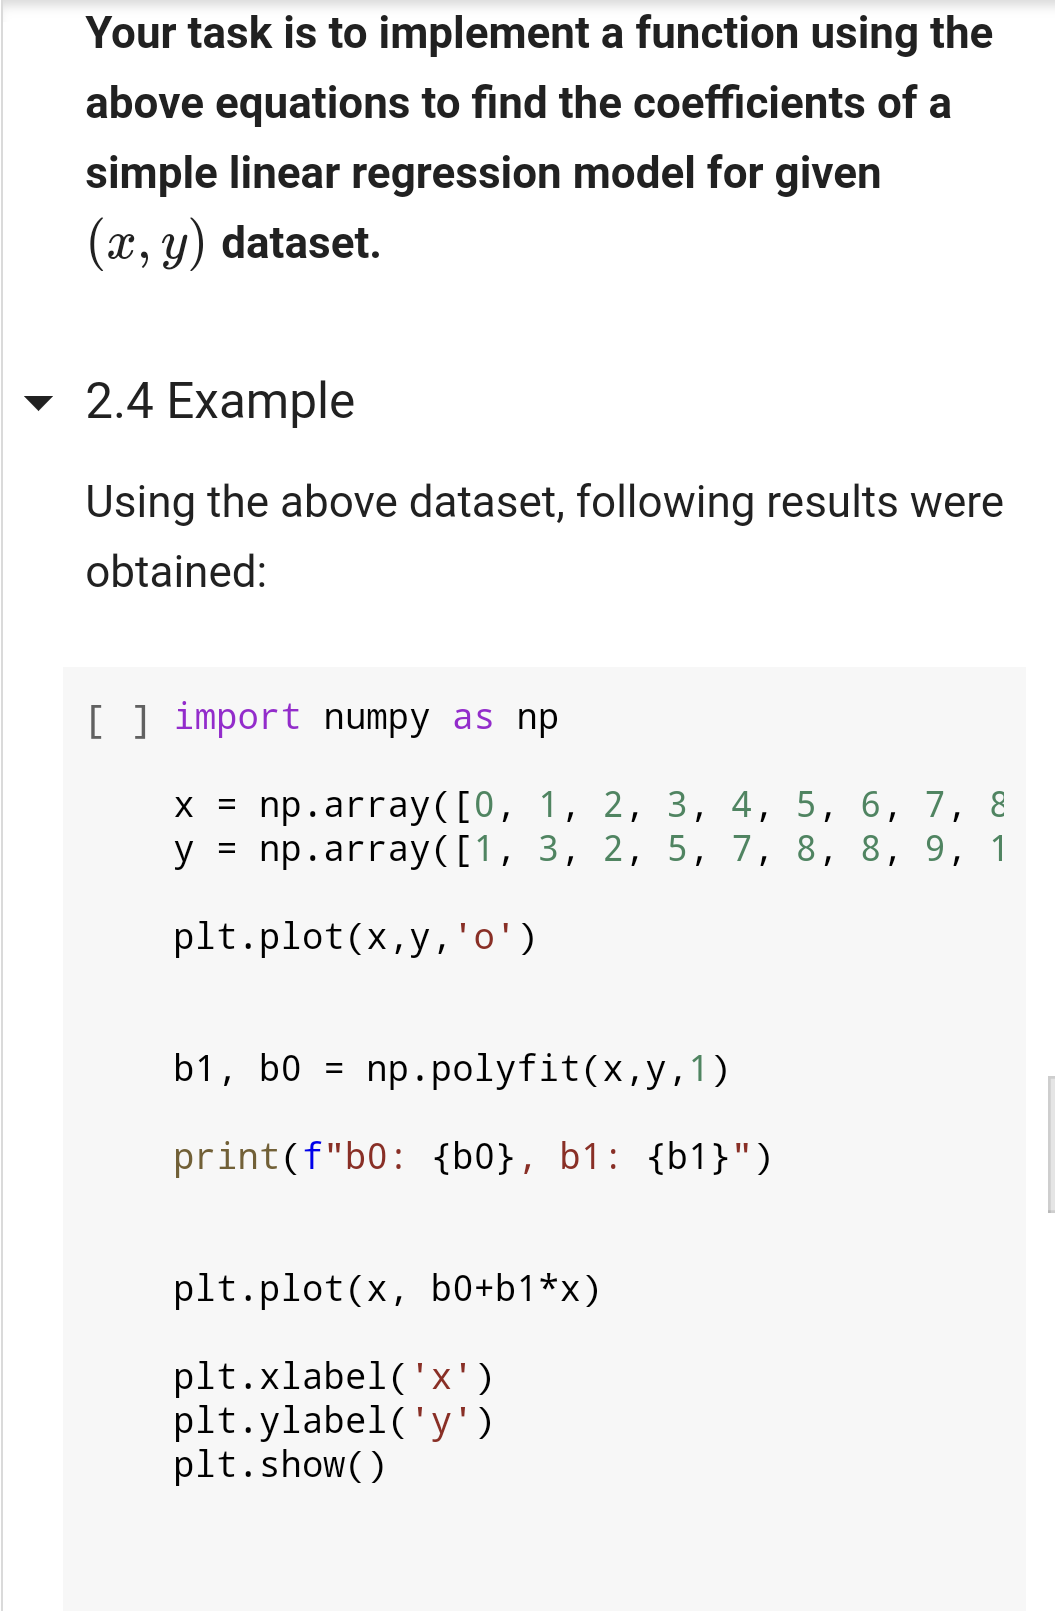
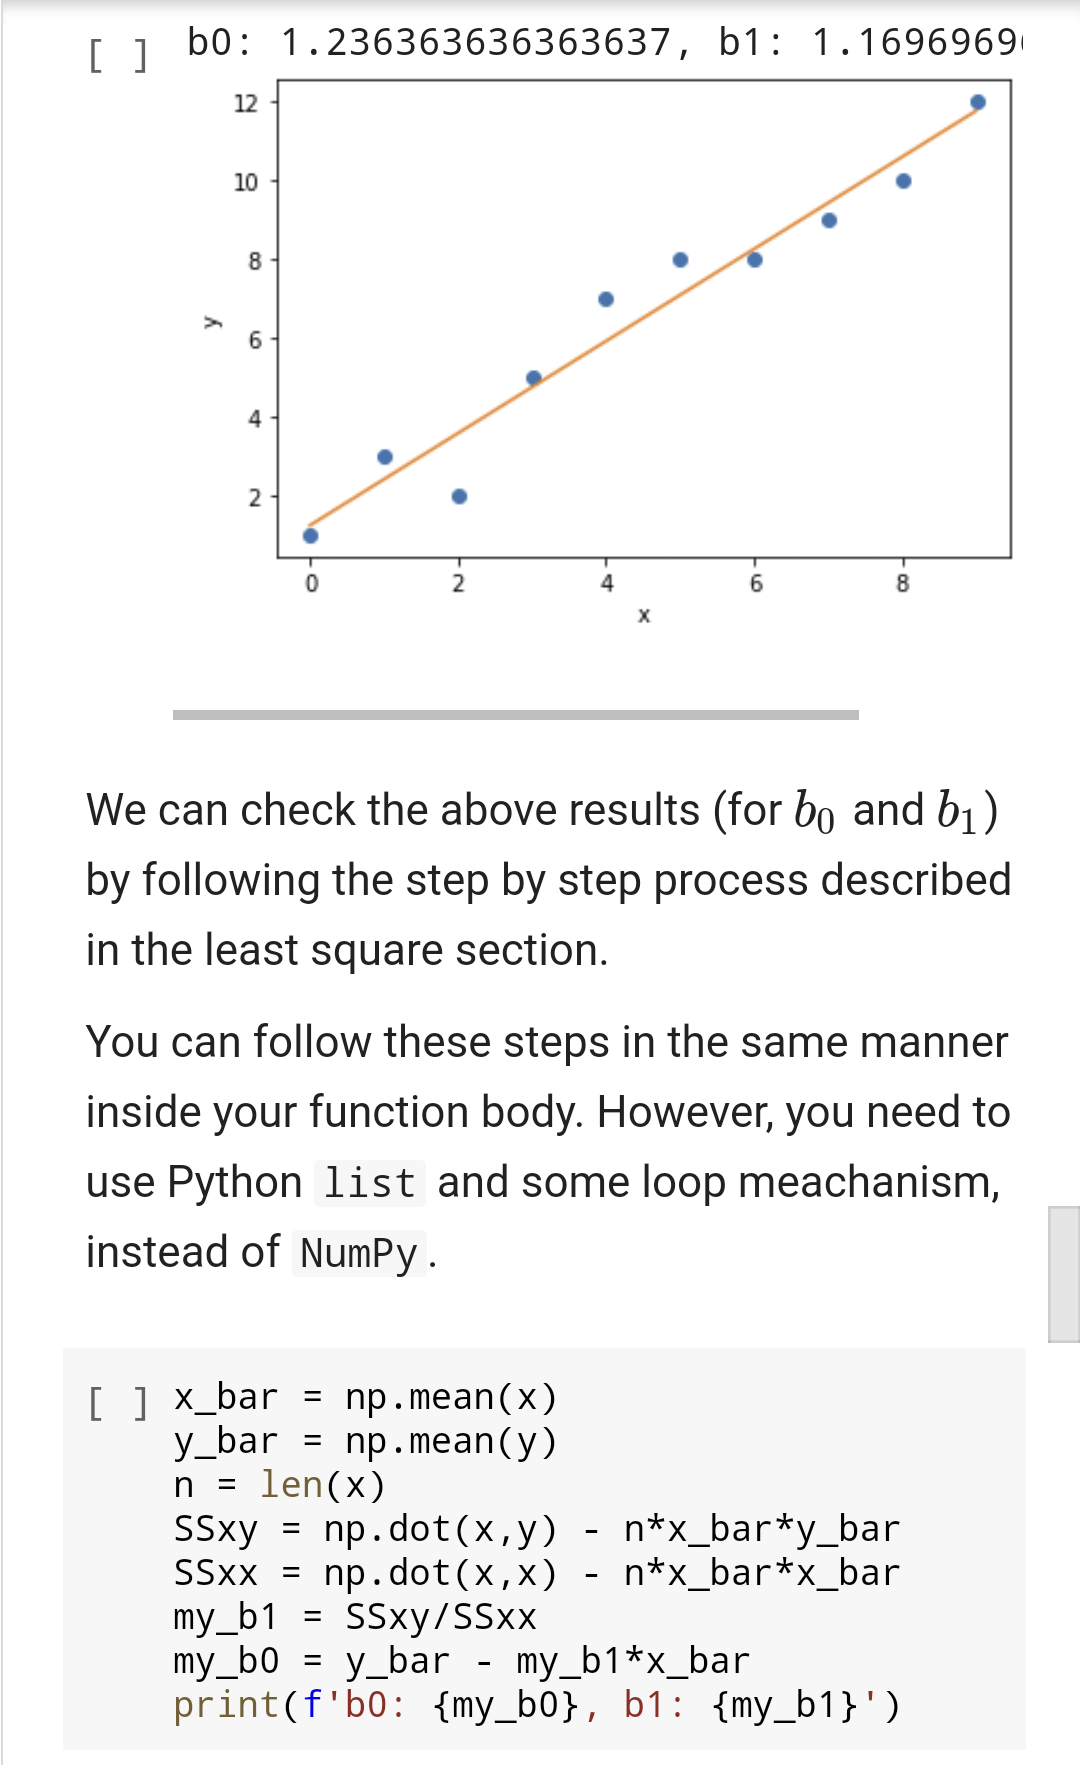
Problem 2: you need to write a function that accepts two lists of numbers of same lenght (representing, independent and dependent variables x and y, respectively) and returns the value of the intercept and the slope of a linear regression line. The required equations and background are provided in the problem description below. You can find some worked out example of this problem using Numpy package. However, you can't use any package to complete this function. Hint: Use loops to calculate mean, SSxx, and ssxy. Problem 2 - Simple Linear Regression 2.1 The Problem: Find the coefficients of the simple linear regression line. 2.2 Background Regression searches for relationships among variables. For example, you can observe several employees of some company and try to understand how their salaries depend on the features, such as experience, level of education, role, city they work in, and so on. Simple linear regression is an approach for predicting a response(dependent variable) using a single feature (independent variable). It is assumed that the two variables are linearly related. Hence, we try to find a linear function that predicts the response value (y) as accurately as possible as a function of the feature or independent variable (x). Let us consider a dataset where we have a value of response y for every feature x for 10 Let us consider a dataset where we have a value of response y for every feature x for 10 observations (provided as 2 different lists in Python): [ ] x [0, 1, 2, 3, 4, 5, 6, 7, 8, 9] y = [1, 3, 2, 5, 7, 8, 8, 9, 10, 12] A scatter plot of the given dataset looks like: [ ] import matplotlib.pyplot as plt plt.scatter(x,y) plt.xlabel('x') plt.ylabel('y') plt. show 12 10 8 6 4 2 2 4 6 8 Now, the task is to find a line which fits best in 12 [] 10 8 y 6 4 2 8 2 Now, the task is to find a line which fits best in above scatter plot so that we can predict the response for any new feature values. (i.e., a value of x not present in dataset) This line is called regression line. The equation of regression line is represented as: (x) = bo + b1 x Here, (x) represents the predicted response value for a given observation X. bo and b are regression coefficients and represent y-intercept and slope of regression line, respectively. To create our model, we must "learn" or estimate the values of regression coefficients bo and bj. And once we've estimated these coefficients, we can use the model to predict responses! We are going to use the Least Squares technique. 2.3 The Least Square Method The predicted values from the model will differ from the actual values, in general. The difference between these two values are known as residual error and least square technique simply minimize the sum of square of the residual errors, where the residual error is: ei = Yi (x;) So, the sum of square error (SSE): SSE = =(y: 9:)? - i Our task is to find the value of bo and by for which SSE is minimum! Without going into the mathematical details, we present the result here: SSxy 1 Without going into the mathematical details, we present the result here: bi SSzy SS.cz - bo = g bZ where SSxy is the sum of cross-deviations of y and x: SSay = (xi 7)(yi ) = yili xy and SSxx is the sum of squared deviations of SSxa = (xi )2 = {x} - n()? where, Eixi T = n Liyi = Note: The complete derivation for finding least squares estimates in simple linear regression can be found here.. Your task is to implement a function using the above equations to find the coefficients of a simple linear regression model for given (2x, y) dataset. 2.4 Example Using the above dataset, following results were obtained: [ ] import numpy as np X = np.array([0, 1, 2, 3, 4, 5, 6, 7, 8 y = np.array([1, 3, 2, 5, 7, 8, 8, 9, 1 plt.plot(x,y,'o') b1, b = np.polyfit(x,y,1) print(f"b0: {b0}, b1: {b1}") plt.plot(x, b0+b1*x) plt.xlabel('x') plt.ylabel('y') plt.show() [ ] bo: 1.236363636363637, b1: 1.1696969 12 10 8 y 6 4 2 2 4 6 8 We can check the above results (for bo and b) by following the step by step process described in the least square section. You can follow these steps in the same manner inside your function body. However, you need to use Python list and some loop meachanism, instead of NumPy. n = [ ] x_bar = np.mean(x) y_bar = np.mean(y) len(x) SSxy = np. dot(x,y) - n*x_bar*y_bar SSXX = np.dot(x,x) - n*x_bar*x_bar my_b1 = Ssxy/SSxx my_b0 = y_bar - my_b1*x_bar print(f'b0: {my_b0}, b1: {my_b1}')Step by Step Solution
There are 3 Steps involved in it
Step: 1

Get Instant Access to Expert-Tailored Solutions
See step-by-step solutions with expert insights and AI powered tools for academic success
Step: 2

Step: 3

Ace Your Homework with AI
Get the answers you need in no time with our AI-driven, step-by-step assistance
Get Started


