

Answered step by step
Verified Expert Solution
Question
1 Approved Answer
help with 2. if this question is too long please answwr half and i will post the other half. thank you :)) 2. The graph
help with 2. if this question is too long please answwr half and i will post the other half. thank you :)) 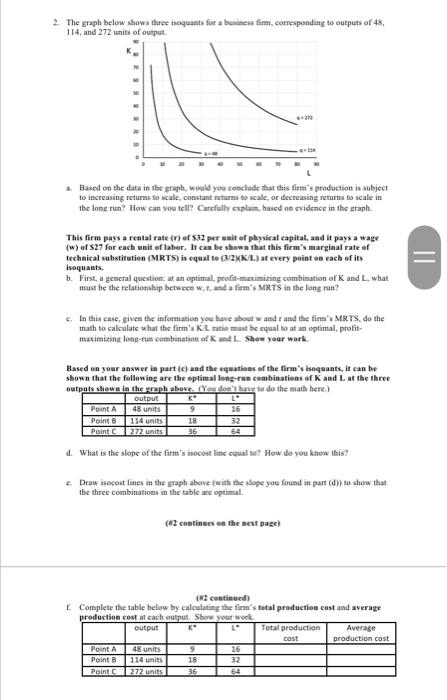
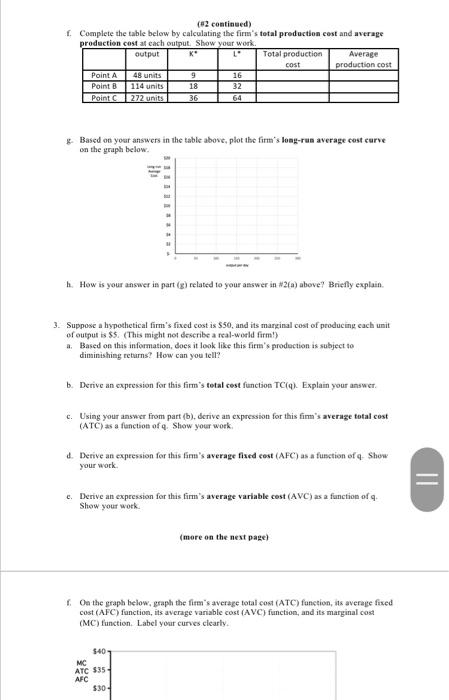
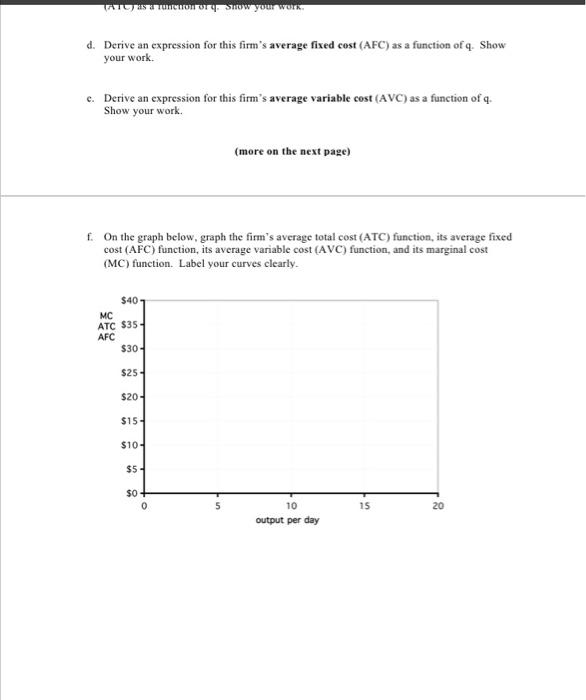
2. The graph below shows three hoquants for a business fim, corresponding to outputs of 48, 114, and 272 units of output . Based on the data in the graph, would you conclude that this firm's production is subject to increasing returns to scale. constant returns to scale, or decreasing returns to scale in the long run? How can you tell? Carefully explain, based on evidence in the graph This firm pays a rental rate (r) of 532 per unit of physical capital and it pays a wage (w) of S27 for each unit of laber. It can be shown that this firm's marginal rate of technical substitution (MRTS) is equal to (3/2K/L) at every point on each of its isequants. b. First, a general question: at an optimal profit-maximizing combination of K and L, what must be the relationship between w., and a firm's MRTS in the long run? = In this caic, given the information you have about wand and the firm's MRTS, do the math to calculate what the firm's K.Late must be equal to at an optimal. profit- maximizing long-run combination of K and L Show your work Based on your answer in part (c) and the equations of the firm's Isoquants, it can be shown that the following are the optimal long-run combinations of K and L at the three outputs shown in the graph abovt. (Yes don't have to do the math here.) Output Point A 48 units 9 16 Point 114 units 18 32 Point C272 units 36 What is the slope of the firm's secast line equal to? How do you know this! Draw isocost lines in the graph above (with the stope you found in part (d) to show that the three combinations in the table are optimal. 612 continues on the next page) (2 continued) Complete the table below by calculating the firm's total production cost and average production costat cach output. Show your work output K Total production Average cost production cost Point A 48 units 9 16 Point B 114 units 18 32 Point 272 units 36 64 (2 continued) 1. Complete the table below by calculating the firm's total production cost and average production cost at each output. Show your work output Ke 1 Total production Average cost production cost Point A 48 units 9 16 Point B 114 units 18 32 Point 272 units 36 64 Based on your answers in the table above, plot the firm's long-run average cost curve on the graph below h. How is your answer in part (g) related to your answer in #2) above Briefly explain. 3. Suppose a hypothetical firm's fixed cost is $50, and its marginal cost of producing each unit of output is $. (This might not describe a real-world firm! a. Based on this information, does it look like this firm's production is subject to diminishing returns? How can you tell? b. Derive an expression for this firm's total cost function TCQ). Explain your answer c. Using your answer from part (b), derive an expression for this fimm's average total cost (ATC) as a function of Show your work 4. Derive an expression for this firm's average fixed cost (AFC) as a function of q. Show your work II c. Derive an expression for this firm's average variable cost (AVC) as a function of a Show your work (more on the next page) On the graph below, graph the firm's average total cost (ATC) function, its average fixed cost (AFC) function, its average variable cost (AVC) function, and its marginal cost (MC) function. Label your curves clearly 540 - MC ATC $35 - AFC $30 TATUS Onry Show your work d. Derive an expression for this firm's average fixed cost (AFC) as a function of q. Show your work. c. Derive an expression for this firm's average variable cost (AVC) as a function of q. Show your work. (more on the next page) f. On the graph below, graph the firm's average total cost (ATC) function, its average fixed cost (AFC) function, its average variable cost (AVC) function, and its marginal cost (MC) function. Label your curves clearly $40 MC ATC $35 AFC $30 $25 $20 - $15 $10- $5 $0 0 15 20 10 output per day 2. The graph below shows three hoquants for a business fim, corresponding to outputs of 48, 114, and 272 units of output . Based on the data in the graph, would you conclude that this firm's production is subject to increasing returns to scale. constant returns to scale, or decreasing returns to scale in the long run? How can you tell? Carefully explain, based on evidence in the graph This firm pays a rental rate (r) of 532 per unit of physical capital and it pays a wage (w) of S27 for each unit of laber. It can be shown that this firm's marginal rate of technical substitution (MRTS) is equal to (3/2K/L) at every point on each of its isequants. b. First, a general question: at an optimal profit-maximizing combination of K and L, what must be the relationship between w., and a firm's MRTS in the long run? = In this caic, given the information you have about wand and the firm's MRTS, do the math to calculate what the firm's K.Late must be equal to at an optimal. profit- maximizing long-run combination of K and L Show your work Based on your answer in part (c) and the equations of the firm's Isoquants, it can be shown that the following are the optimal long-run combinations of K and L at the three outputs shown in the graph abovt. (Yes don't have to do the math here.) Output Point A 48 units 9 16 Point 114 units 18 32 Point C272 units 36 What is the slope of the firm's secast line equal to? How do you know this! Draw isocost lines in the graph above (with the stope you found in part (d) to show that the three combinations in the table are optimal. 612 continues on the next page) (2 continued) Complete the table below by calculating the firm's total production cost and average production costat cach output. Show your work output K Total production Average cost production cost Point A 48 units 9 16 Point B 114 units 18 32 Point 272 units 36 64 (2 continued) 1. Complete the table below by calculating the firm's total production cost and average production cost at each output. Show your work output Ke 1 Total production Average cost production cost Point A 48 units 9 16 Point B 114 units 18 32 Point 272 units 36 64 Based on your answers in the table above, plot the firm's long-run average cost curve on the graph below h. How is your answer in part (g) related to your answer in #2) above Briefly explain. 3. Suppose a hypothetical firm's fixed cost is $50, and its marginal cost of producing each unit of output is $. (This might not describe a real-world firm! a. Based on this information, does it look like this firm's production is subject to diminishing returns? How can you tell? b. Derive an expression for this firm's total cost function TCQ). Explain your answer c. Using your answer from part (b), derive an expression for this fimm's average total cost (ATC) as a function of Show your work 4. Derive an expression for this firm's average fixed cost (AFC) as a function of q. Show your work II c. Derive an expression for this firm's average variable cost (AVC) as a function of a Show your work (more on the next page) On the graph below, graph the firm's average total cost (ATC) function, its average fixed cost (AFC) function, its average variable cost (AVC) function, and its marginal cost (MC) function. Label your curves clearly 540 - MC ATC $35 - AFC $30 TATUS Onry Show your work d. Derive an expression for this firm's average fixed cost (AFC) as a function of q. Show your work. c. Derive an expression for this firm's average variable cost (AVC) as a function of q. Show your work. (more on the next page) f. On the graph below, graph the firm's average total cost (ATC) function, its average fixed cost (AFC) function, its average variable cost (AVC) function, and its marginal cost (MC) function. Label your curves clearly $40 MC ATC $35 AFC $30 $25 $20 - $15 $10- $5 $0 0 15 20 10 output per day Step by Step Solution
There are 3 Steps involved in it
Step: 1

Get Instant Access to Expert-Tailored Solutions
See step-by-step solutions with expert insights and AI powered tools for academic success
Step: 2

Step: 3
Ace Your Homework with AI
Get the answers you need in no time with our AI-driven, step-by-step assistance
Get Started
Financial And Managerial Accounting
Authors: Charles T. Horngren, Walter T. Harrison Jr., M. Suzanne Oliver
1st Edition
0558241050, 978-0558241056