

Answered step by step
Verified Expert Solution
Question
1 Approved Answer
help with question E please there unbers alief re coung the costs relating to restructuring activi is The tabes calculate nat inodme and Mpenating, nocme
help with question E please
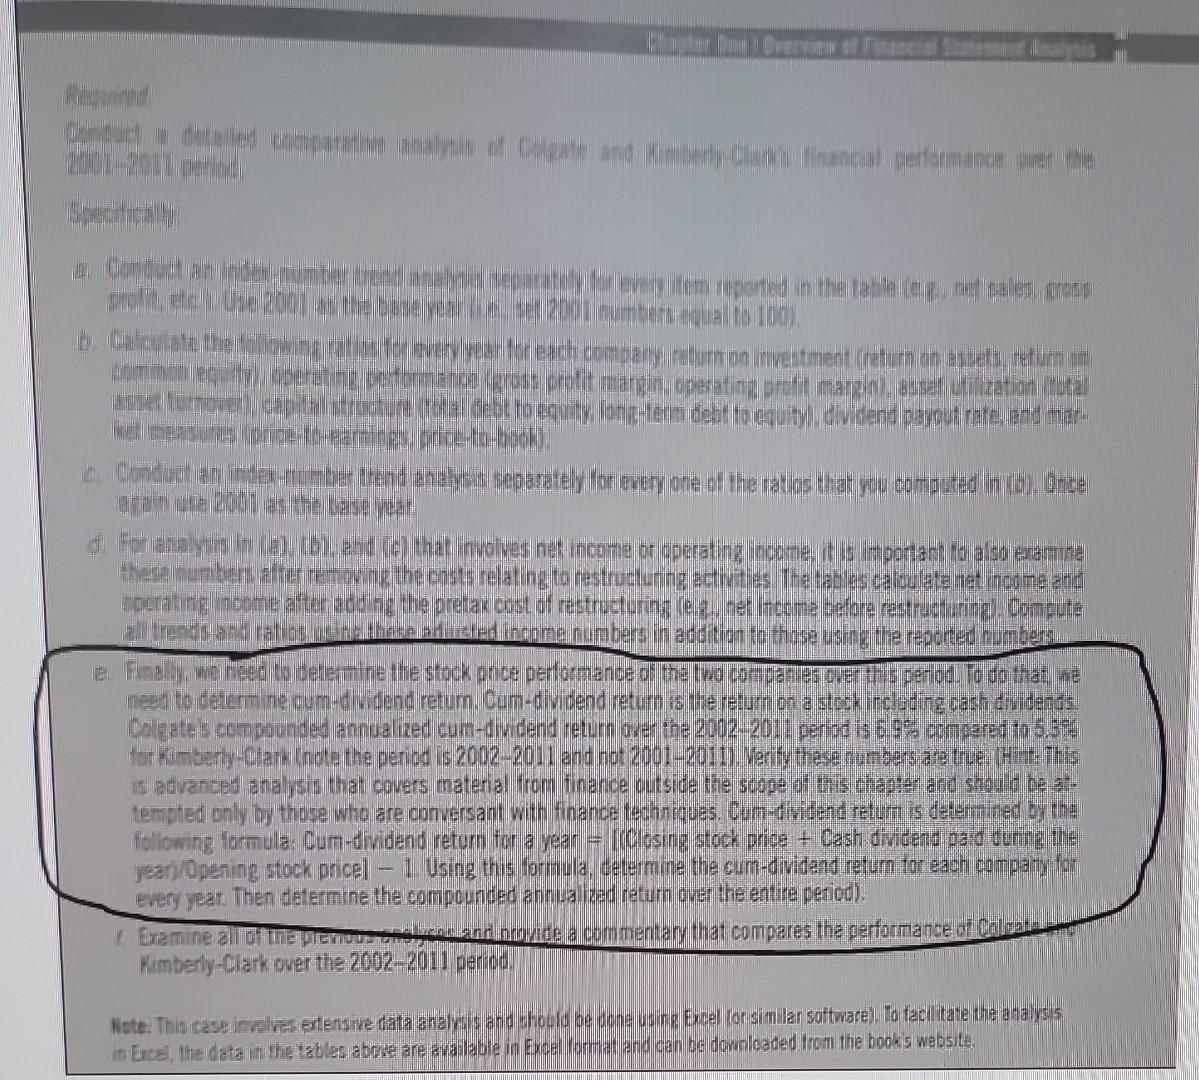
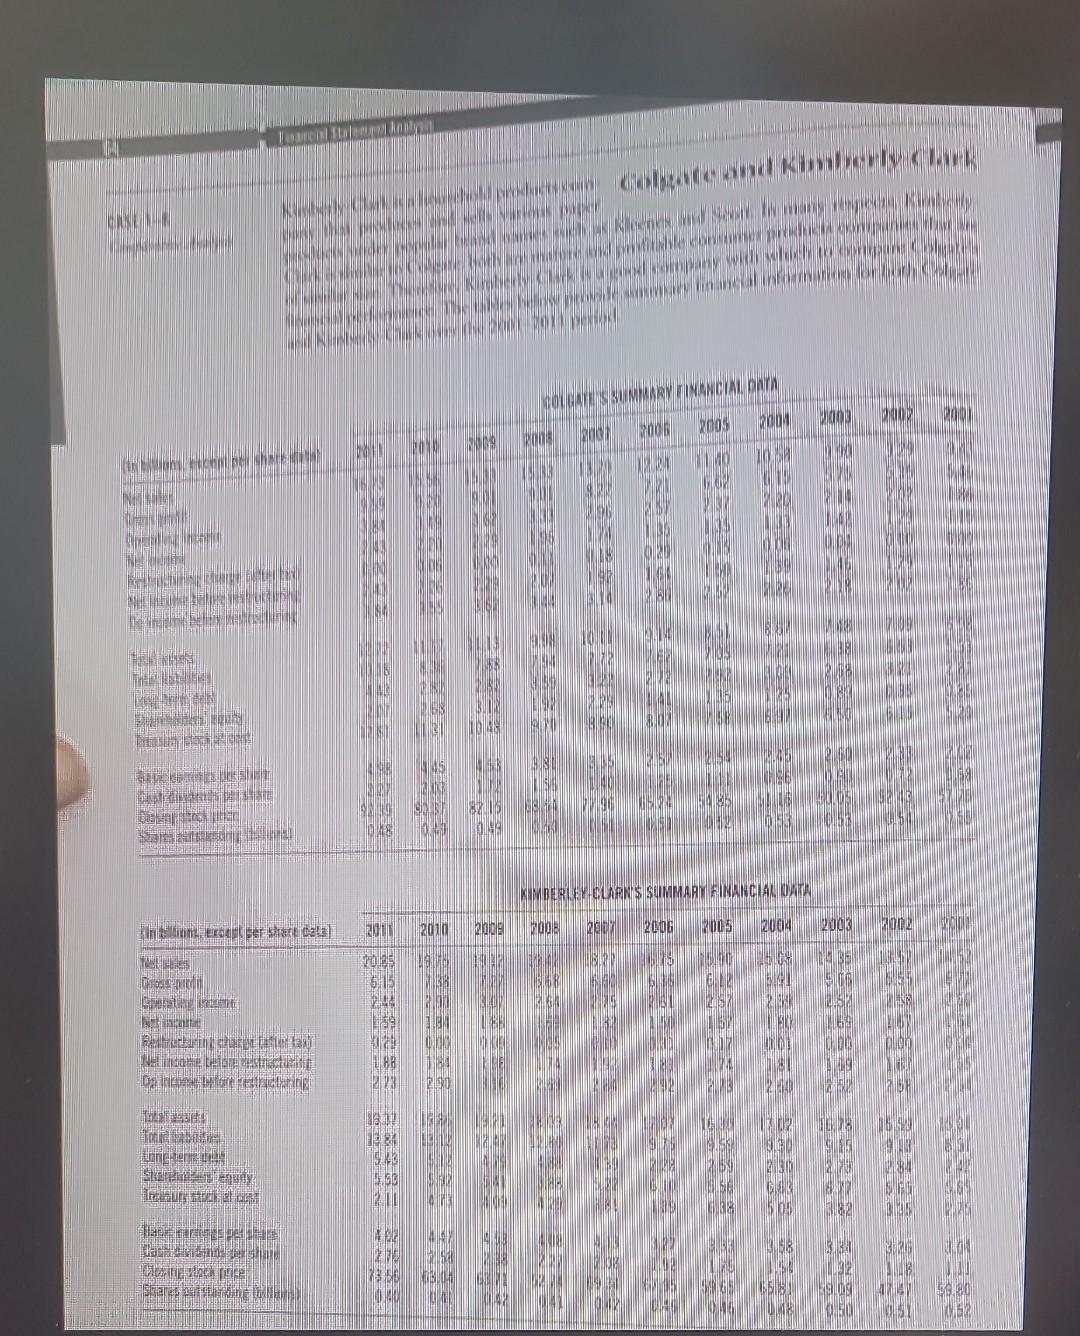
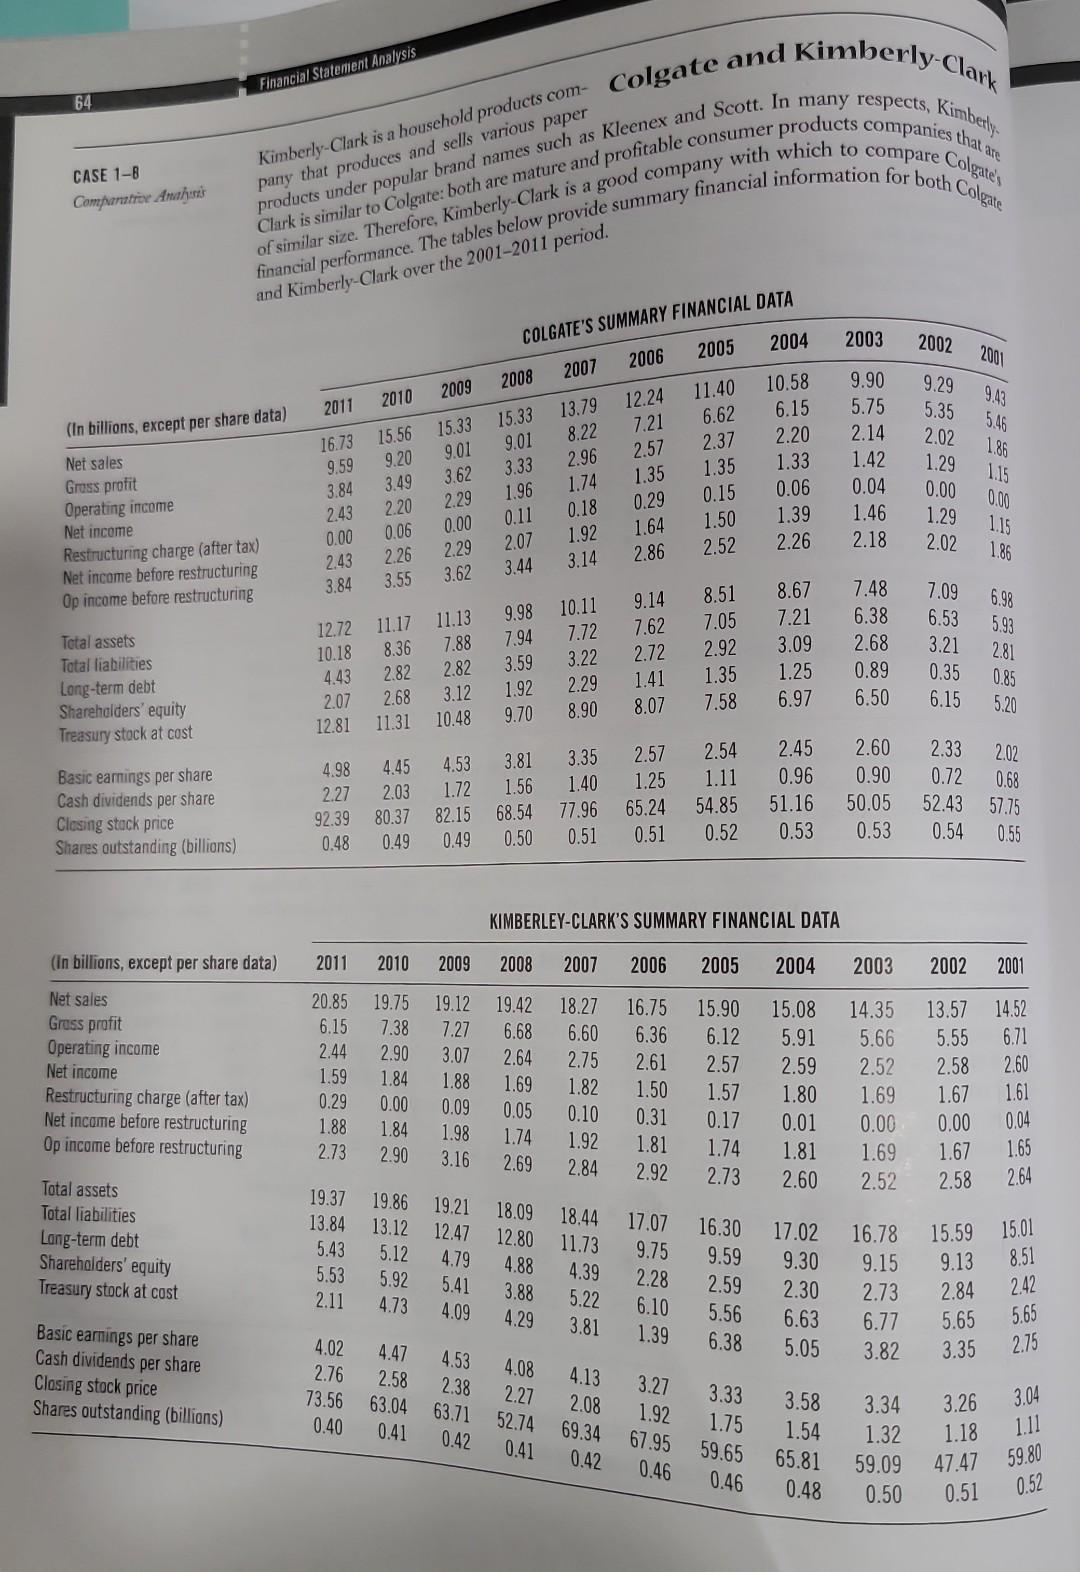
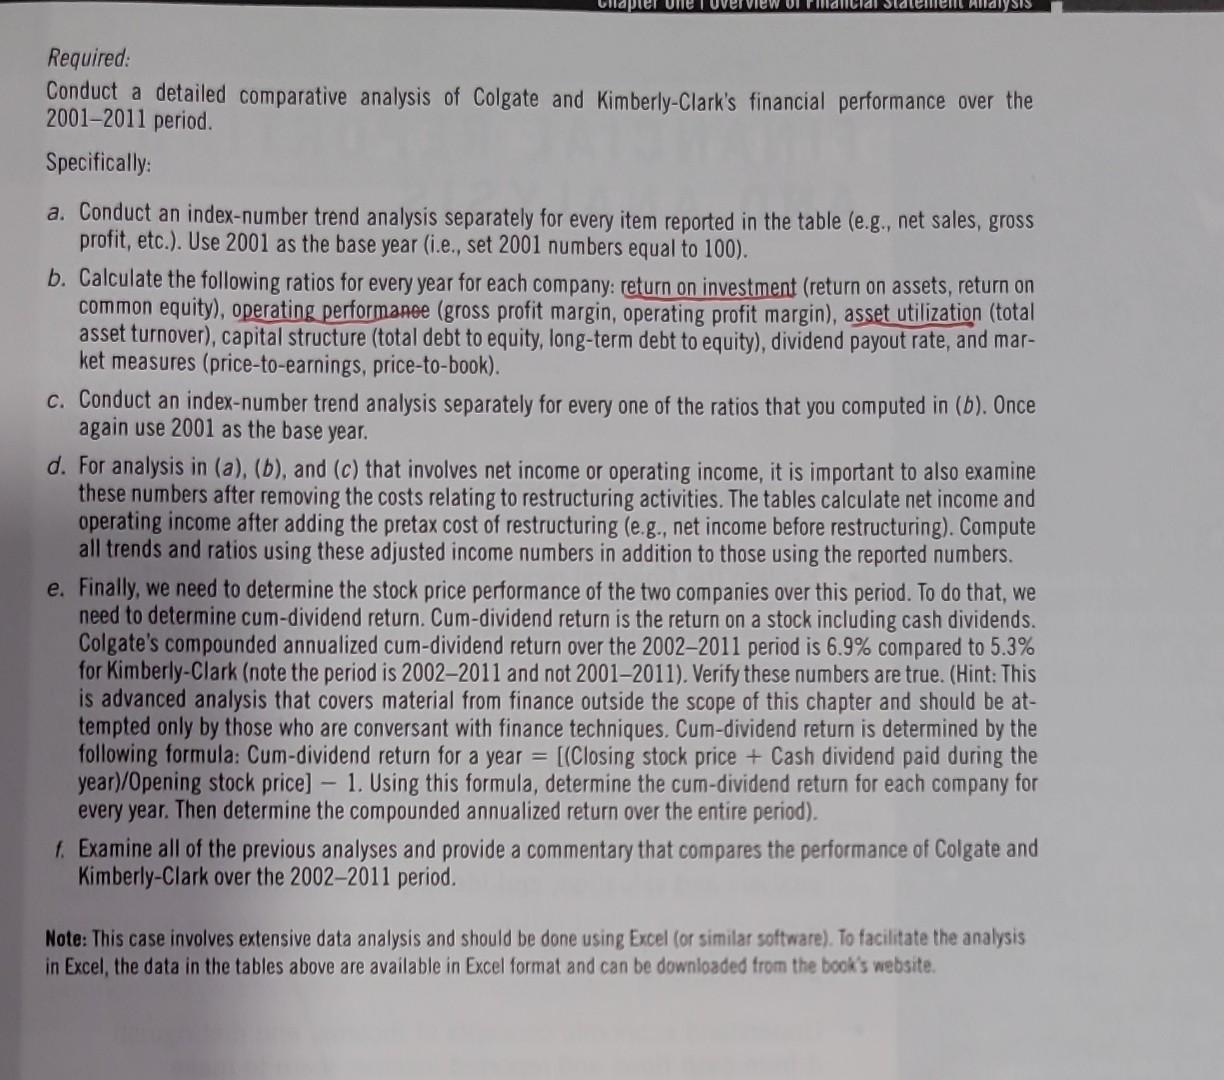
there unbers alief re coung the costs relating to restructuring activi is The tabes calculate nat inodme and Mpenating, nocme aftor add ing the pretax cost. of restructuring (e.z, sef incoma sefore retructuring). Computa neat to detern ine cum-didend retum. Cum-dividend retum is the relum on a stcok irclading cast dividands. Coleates compoundes annualized cum-dividend return oue the 2002-201. period is 6.9% compared to 5.5% far kimbery-Ciark tnote the pericd is 20022011 and not 20012011. Verify these numbers are trues (Hirt: This is advanced analysis that covers material from finance outside tile scope of tis chapter and shiould be at. tempted oaly oy those who are conversant with finance tedhniques. Cun-dwidend retum is determined by the following formula: Cum-dividend return for a year = [cCosing stock price + Cash dividend padd during the jeari/Opening stock pricel - 1. Using this fiarmula, determine the cum-dividand retum for each campary for: Every yeat. Then determine the compounded annua ized retum cver the entire pericd). Kimberly-Clark over the 2002-2011 peripd. ousehold sells various paper of similar size. Therefore, Kimberly-Clark is a good comp financial performance. The tables below provide sur. VIMDEDI LV RI ADU'C CIIMMADV CIMANCIAI NATA Required: Conduct a detailed comparative analysis of Colgate and Kimberly-Clark's financial performance over the 2001-2011 period. Specifically: a. Conduct an index-number trend analysis separately for every item reported in the table (e.g., net sales, gross profit, etc.). Use 2001 as the base year (i.e., set 2001 numbers equal to 100). b. Calculate the following ratios for every year for each company: return on investment (return on assets, return on common equity), operating performanoe (gross profit margin, operating profit margin), asset utilization (total asset turnover), capital structure (total debt to equity, long-term debt to equity), dividend payout rate, and market measures (price-to-earnings, price-to-book). c. Conduct an index-number trend analysis separately for every one of the ratios that you computed in (b). Once again use 2001 as the base year. d. For analysis in (a), (b), and (c) that involves net income or operating income, it is important to also examine these numbers after removing the costs relating to restructuring activities. The tables calculate net income and operating income after adding the pretax cost of restructuring (e.g., net income before restructuring). Compute all trends and ratios using these adjusted income numbers in addition to those using the reported numbers. e. Finally, we need to determine the stock price performance of the two companies over this period. To do that, we need to determine cum-dividend return. Cum-dividend return is the return on a stock including cash dividends. Colgate's compounded annualized cum-dividend return over the 2002-2011 period is 6.9% compared to 5.3% for Kimberly-Clark (note the period is 2002-2011 and not 2001-2011). Verify these numbers are true. (Hint: This is advanced analysis that covers material from finance outside the scope of this chapter and should be attempted only by those who are conversant with finance techniques. Cum-dividend return is determined by the following formula: Cum-dividend return for a year =[( Closing stock price + Cash dividend paid during the year)/Opening stock price] - 1. Using this formula, determine the cum-dividend return for each company for every year. Then determine the compounded annualized return over the entire period). f. Examine all of the previous analyses and provide a commentary that compares the performance of Colgate and Kimberly-Clark over the 2002-2011 period. Note: This case involves extensive data analysis and should be done using Excel (or similar software). To facilitate the analysis in Excel, the data in the tables above are available in Excel format and can be downloaded from the book's website. there unbers alief re coung the costs relating to restructuring activi is The tabes calculate nat inodme and Mpenating, nocme aftor add ing the pretax cost. of restructuring (e.z, sef incoma sefore retructuring). Computa neat to detern ine cum-didend retum. Cum-dividend retum is the relum on a stcok irclading cast dividands. Coleates compoundes annualized cum-dividend return oue the 2002-201. period is 6.9% compared to 5.5% far kimbery-Ciark tnote the pericd is 20022011 and not 20012011. Verify these numbers are trues (Hirt: This is advanced analysis that covers material from finance outside tile scope of tis chapter and shiould be at. tempted oaly oy those who are conversant with finance tedhniques. Cun-dwidend retum is determined by the following formula: Cum-dividend return for a year = [cCosing stock price + Cash dividend padd during the jeari/Opening stock pricel - 1. Using this fiarmula, determine the cum-dividand retum for each campary for: Every yeat. Then determine the compounded annua ized retum cver the entire pericd). Kimberly-Clark over the 2002-2011 peripd. ousehold sells various paper of similar size. Therefore, Kimberly-Clark is a good comp financial performance. The tables below provide sur. VIMDEDI LV RI ADU'C CIIMMADV CIMANCIAI NATA Required: Conduct a detailed comparative analysis of Colgate and Kimberly-Clark's financial performance over the 2001-2011 period. Specifically: a. Conduct an index-number trend analysis separately for every item reported in the table (e.g., net sales, gross profit, etc.). Use 2001 as the base year (i.e., set 2001 numbers equal to 100). b. Calculate the following ratios for every year for each company: return on investment (return on assets, return on common equity), operating performanoe (gross profit margin, operating profit margin), asset utilization (total asset turnover), capital structure (total debt to equity, long-term debt to equity), dividend payout rate, and market measures (price-to-earnings, price-to-book). c. Conduct an index-number trend analysis separately for every one of the ratios that you computed in (b). Once again use 2001 as the base year. d. For analysis in (a), (b), and (c) that involves net income or operating income, it is important to also examine these numbers after removing the costs relating to restructuring activities. The tables calculate net income and operating income after adding the pretax cost of restructuring (e.g., net income before restructuring). Compute all trends and ratios using these adjusted income numbers in addition to those using the reported numbers. e. Finally, we need to determine the stock price performance of the two companies over this period. To do that, we need to determine cum-dividend return. Cum-dividend return is the return on a stock including cash dividends. Colgate's compounded annualized cum-dividend return over the 2002-2011 period is 6.9% compared to 5.3% for Kimberly-Clark (note the period is 2002-2011 and not 2001-2011). Verify these numbers are true. (Hint: This is advanced analysis that covers material from finance outside the scope of this chapter and should be attempted only by those who are conversant with finance techniques. Cum-dividend return is determined by the following formula: Cum-dividend return for a year =[( Closing stock price + Cash dividend paid during the year)/Opening stock price] - 1. Using this formula, determine the cum-dividend return for each company for every year. Then determine the compounded annualized return over the entire period). f. Examine all of the previous analyses and provide a commentary that compares the performance of Colgate and Kimberly-Clark over the 2002-2011 period. Note: This case involves extensive data analysis and should be done using Excel (or similar software). To facilitate the analysis in Excel, the data in the tables above are available in Excel format and can be downloaded from the book's website
Step by Step Solution
There are 3 Steps involved in it
Step: 1

Get Instant Access to Expert-Tailored Solutions
See step-by-step solutions with expert insights and AI powered tools for academic success
Step: 2

Step: 3
Ace Your Homework with AI
Get the answers you need in no time with our AI-driven, step-by-step assistance
Get Started
Audit Accountability And Government
Authors: Fidelma White, Kathryn Hollingsworth
1st Edition
0198262329, 978-0198262329