Answered step by step
Verified Expert Solution
Link Copied!

Question

1 Approved Answer

Hercules Exercise Equipment Co. purchased a computerized measuring device two years ago for $84,000. The equipment falls into the five-year category for MACRS depreciation and

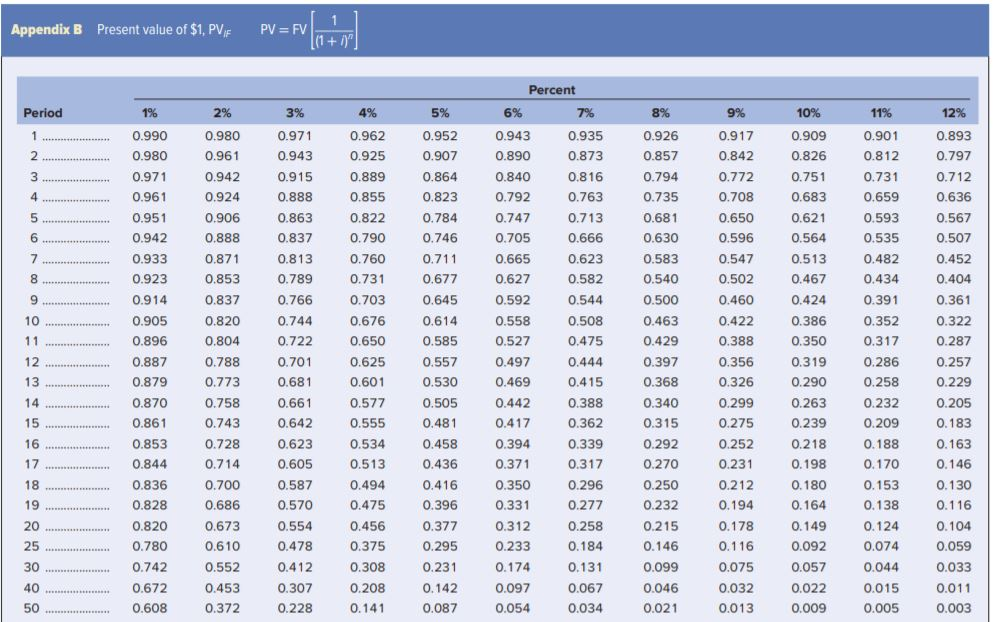
Hercules Exercise Equipment Co. purchased a computerized measuring device two years ago for $84,000. The equipment falls into the five-year category for MACRS depreciation and can currently be sold for $37,800. A new piece of equipment will cost $205,000. It also falls into the five-year category for MACRS depreciation. Assume the new equipment would provide the following stream of added cost savings for the next six years. Use Table 1212. Use Appendix B for an approximate answer but calculate your final answer using the formula and financial calculator methods.

Year Cash Savings
1 $ 64,000
2 54,000
3 52,000
4 50,000
5 47,000
6 36,000

The firms tax rate is 25 percent and the cost of capital is 10 percent.

i. Compute the aftertax benefits of the cost savings. (Enter the aftertax factor as a decimal rounded to 2 decimal places. Round all other answers to the nearest whole dollar.)

Year Savings (1 Tax Rate) Aftertax Savings
1 $64,000
2 54,000
3 52,000
4 50,000
5 47,000
6 36,000

j-1. Add the depreciation tax shield benefits and the aftertax cost savings to determine the total annual benefits. (Do not round intermediate calculations and round your answers to the nearest whole dollar.)

Year Tax Shield Benefits from Depreciation Aftertax Cost Savings Total Annual Benefits
1
2
3
4
5
6

j-2. Compute the present value of the total annual benefits. (Do not round intermediate calculations and round your answer to the nearest whole dollar.) Present Value: ____________

k-1. Compare the present value of the incremental benefits (j) to the net cost of the new equipment (e). (Do not round intermediate calculations. Negative amount should be indicated by a minus sign. Round your answer to the nearest whole dollar.)

Net Present Value: ____________image text in transcribedimage text in transcribed
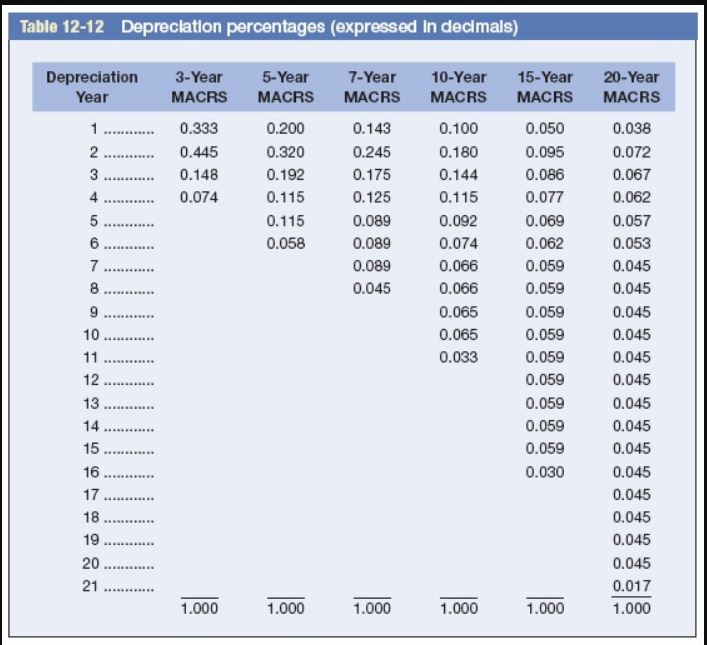
Table 12-12 Depreciation percentages (expressed in decimals) Depreciation Year 3-Year MACRS 5-Year 7-Year 10-Year 15-Year MACRS MACRS MACRS MACRS 20-Year MACRS 0.333 0.445 0.148 0.074 0.200 0.320 0.192 0.115 0.115 0.058 0.143 0.245 0.175 0.125 0.089 0.089 0.089 0.045 0.100 0.180 0.144 0.115 0.092 0.074 0.066 0.066 0.065 0.065 0.033 0.050 0.095 0.086 0.077 0.069 0.062 0.059 0.059 0.059 0.059 0.059 0.059 0.059 0.059 0.059 0.030 0.038 0.072 0.067 0.062 0.057 0.053 0.045 0.045 0.045 0.045 0.045 0.045 0.045 0.045 0.045 0.045 0.045 0.045 0.045 0.045 0.017 1.000 1.000 1.000 1.000 1.000 1.000 Appendix B Present value of $1, PV, PV = 1 Period 10% 0.909 0.826 0.751 0.683 0.621 0.564 11% 0.901 0.812 0.731 0.659 0.593 0.535 0.482 0.434 0.391 0.352 0.317 0.513 1% 0.990 0.980 0.971 0.961 0.951 0.942 0.933 0.923 0.914 0.905 0.896 0.887 0.879 0.870 0.861 0.853 0.844 0.836 0.828 0.820 0.780 0.742 0.672 0.608 2% 0.980 0.961 0.942 0.924 0.906 0.888 0.871 0.853 0.837 0.820 0.804 0.788 0.773 0.758 0.743 0.728 0.714 0.700 0.686 0.673 0.610 0.552 0.453 0.372 3% 0.971 0.943 0.915 0.888 0.863 0.837 0.813 0.789 0.766 0.744 0.722 0.701 0.681 0.661 0.642 0.623 0.605 0.587 0.570 0.554 0.478 0.412 0.307 0.228 4% 0.962 0.925 0.889 0.855 0.822 0.790 0.760 0.731 0.703 0.676 0.650 0.625 0.601 0.577 0.555 0.534 0.513 0.494 0.475 0.456 0.375 0.308 0.208 0.141 5% 0.952 0.907 0.864 0.823 0.784 0.746 0.711 0.677 0.645 0.614 0.585 0.557 0.530 0.505 0.481 0.458 0.436 0.416 0.396 0.377 0.295 0.231 0.142 0.087 Percent 6% 7% 0.943 0.935 0.890 0.873 0.840 0.816 0.792 0.763 0.747 0.713 0.705 0.666 0.665 0.623 0.627 0.582 0.592 0.544 0.558 0.508 0.527 0.475 0.497 0.444 0.469 0.415 0.442 0.388 0.417 0.362 0.394 0.339 0.371 0.317 0.350 0.296 0.331 0.277 0.312 0.258 0.233 0.184 0.174 0.131 0.097 0.067 0.054 0.034 8% 0.926 0.857 0.794 0.735 0.681 0.630 0.583 0.540 0.500 0.463 0.429 0.397 0.368 0.340 0.315 0.292 0.270 0.250 0.232 0.215 0.146 0.099 0.046 0.021 9% 0.917 0.842 0.772 0.708 0.650 0.596 0.547 0.502 0.460 0.422 0.388 0.356 0.326 0.299 0.275 0.252 0.231 0.212 0.194 0.178 0.116 0.075 0.032 0.013 0.286 0.467 0.424 0.386 0.350 0.319 0.290 0.263 0.239 0.218 0.198 0.180 0.164 0.149 0.092 0.057 0.022 0.009 12% 0.893 0.797 0.712 0.636 0.567 0.507 0.452 0.404 0.361 0.322 0.287 0.257 0.229 0.205 0.183 0.163 0.146 0.130 0.116 0.104 0.059 0.033 0.011 0.003 0.258 0.232 0.209 0.188 0.170 0.153 0.138 0.124 0.074 0.044 0.015 0.005 50

Step by Step Solution

There are 3 Steps involved in it

Step: 1

blur-text-image

Get Instant Access to Expert-Tailored Solutions

See step-by-step solutions with expert insights and AI powered tools for academic success

Step: 2

blur-text-image

Step: 3

blur-text-image

Ace Your Homework with AI

Get the answers you need in no time with our AI-driven, step-by-step assistance

Get Started

Recommended Textbook for

Intermediate Financial Management

Authors: Brigham, Daves

10th Edition

978-1439051764, 1111783659, 9780324594690, 1439051763, 9781111783655, 324594690, 978-1111021573

More Books

Students also viewed these Finance questions

Question

Does your report have an attractive appearance?

Answered: 1 week ago