

Answered step by step
Verified Expert Solution
Question
1 Approved Answer
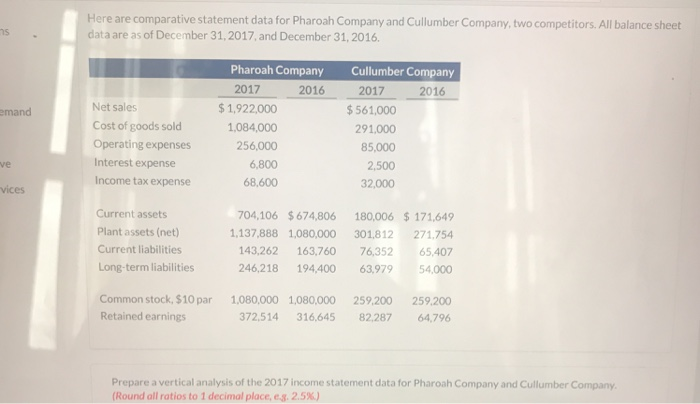
Here are comparative statement data for Pharoah Company and Cullumber Company, two competitors. All balance sheet data are as of December 31,2017, and December 31,2016
Step by Step Solution
There are 3 Steps involved in it
Step: 1

Get Instant Access to Expert-Tailored Solutions
See step-by-step solutions with expert insights and AI powered tools for academic success
Step: 2

Step: 3
Ace Your Homework with AI
Get the answers you need in no time with our AI-driven, step-by-step assistance
Get Started
Handbook Of EDP Auditing
Authors: Michael A. Murphy, Xenia Ley Parker
2nd Edition
0791304116, 978-0791304112