

Answered step by step
Verified Expert Solution
Question
1 Approved Answer
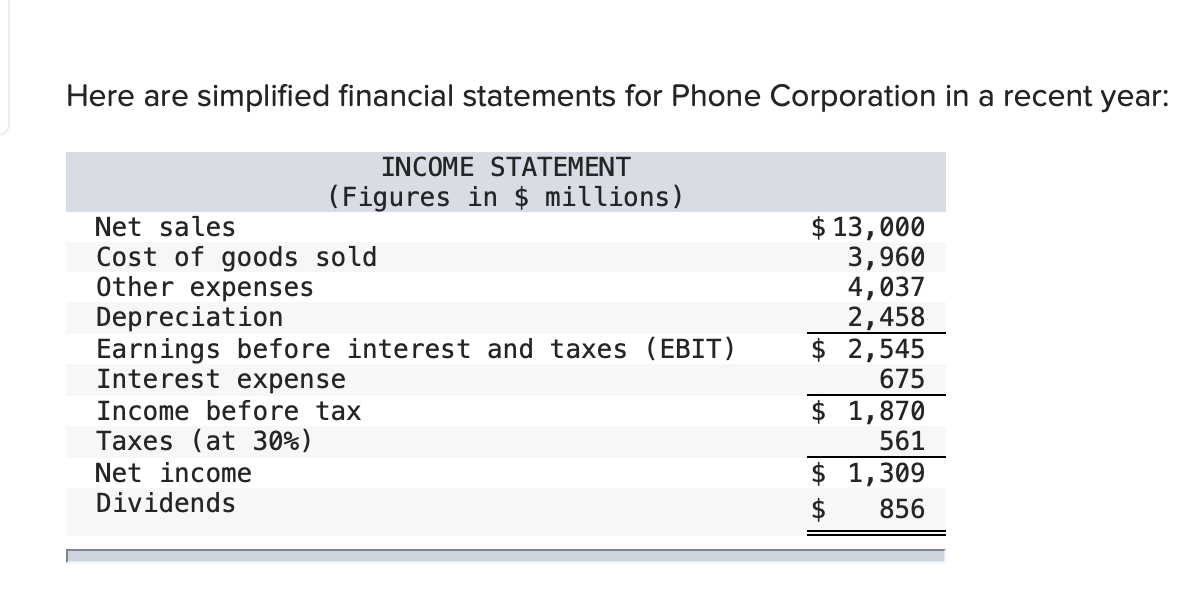
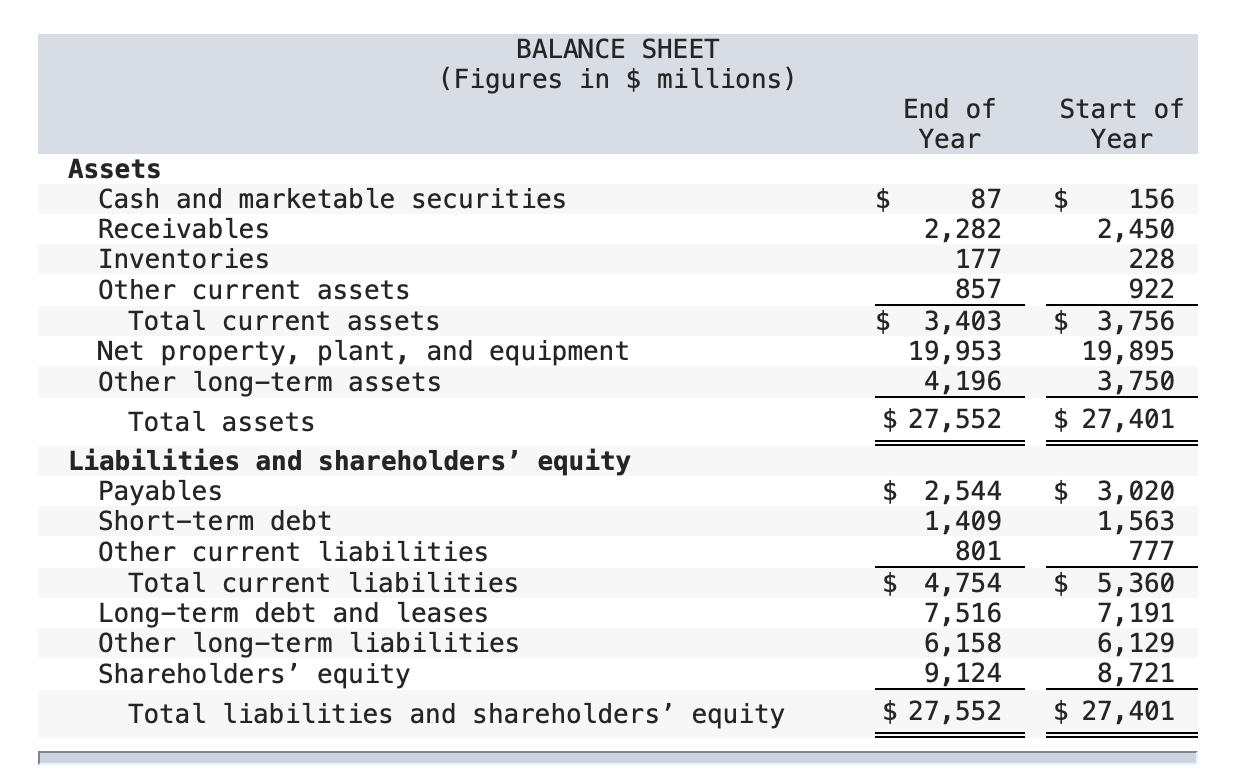
Here are simplified financial statements for Phone Corporation in a recent year: INCOME STATEMENT (Figures in $ millions) Net sales Cost of goods sold Other
Step by Step Solution
There are 3 Steps involved in it
Step: 1

Get Instant Access to Expert-Tailored Solutions
See step-by-step solutions with expert insights and AI powered tools for academic success
Step: 2

Step: 3
Ace Your Homework with AI
Get the answers you need in no time with our AI-driven, step-by-step assistance
Get Started
Short Term Financial Management
Authors: Ned C Hill
1st Edition
0023548207, 978-0023548208