Question
Here are the Balance Sheet and Income Statement of a high-tech company from 2018 to 2021. Please copy them into your Excel file. Alphebet A
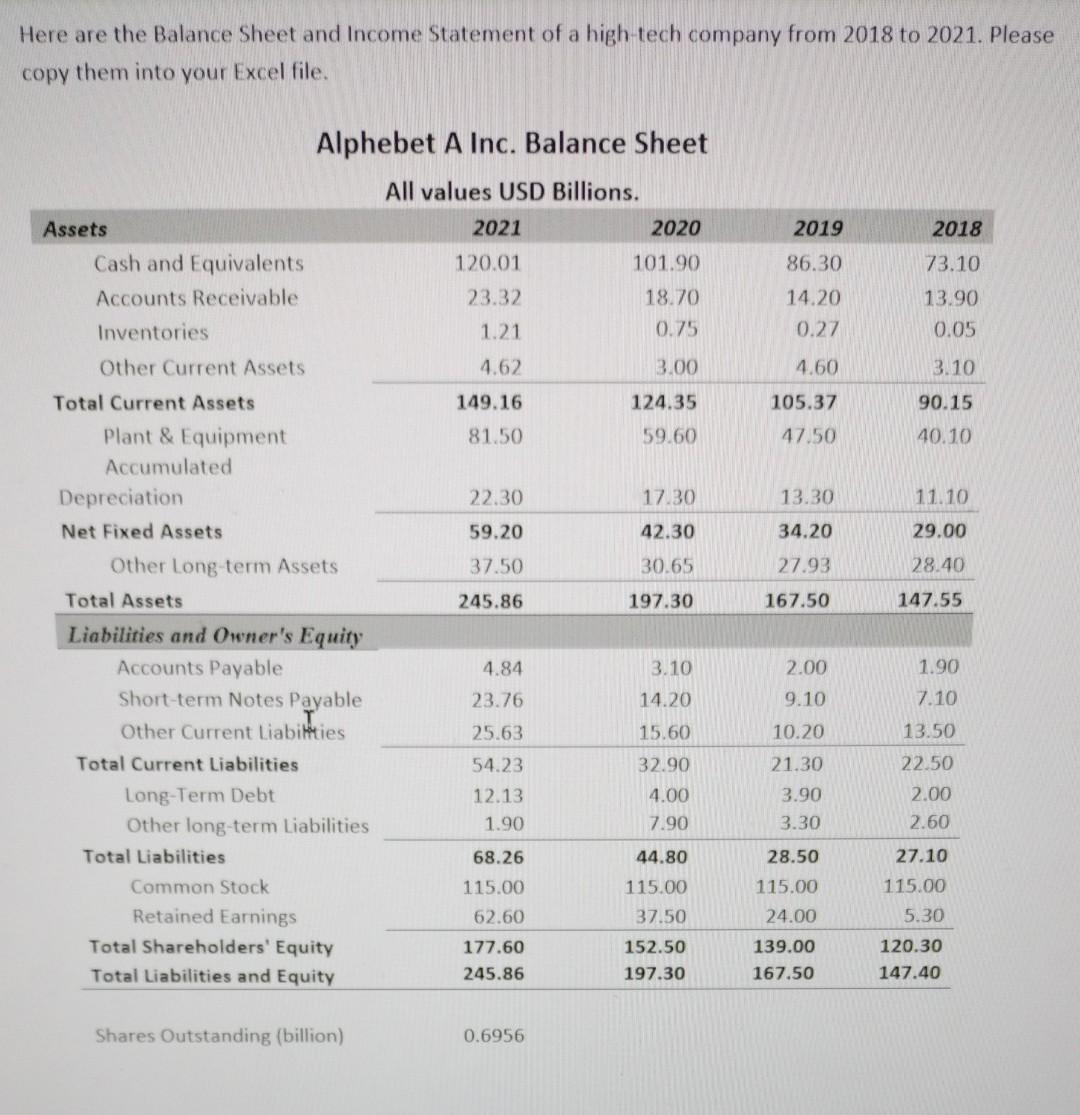
Here are the Balance Sheet and Income Statement of a high-tech company from 2018 to 2021. Please copy them into your Excel file. Alphebet A Inc. Balance Sheet All values USD Billions. Assets 2021202020192018 Cash and Equivalents120.01101.9086.3073.10 Accounts Receivable23.3218.7014.2013.90 Inventories1.210.750.270.05 Other Current Assets4.623.004.603.10 Total Current Assets149.16124.35105.3790.15 Plant & Equipment81.5059.6047.5040.10 Accumulated Depreciation22.3017.3013.3011.10 Net Fixed Assets59.2042.3034.2029.00 Other Long-term Assets37.5030.6527.9328.40 Total Assets245.86197.30167.50147.55 Liabilities and Owner's Equity Accounts Payable4.843.102.001.90 Short-term Notes Payable23.7614.209.107.10 Other Current Liabilities25.6315.6010.2013.50 Total Current Liabilities54.2332.9021.3022.50 Long-Term Debt12.134.003.902.00 Other long-term Liabilities1.907.903.302.60 Total Liabilities68.2644.8028.5027.10 Common Stock115.00115.00115.00115.00 Retained Earnings62.6037.5024.005.30 Total Shareholders' Equity177.60152.50139.00120.30 Total Liabilities and Equity245.86197.30167.50147.40
Shares Outstanding (billion)0.6956
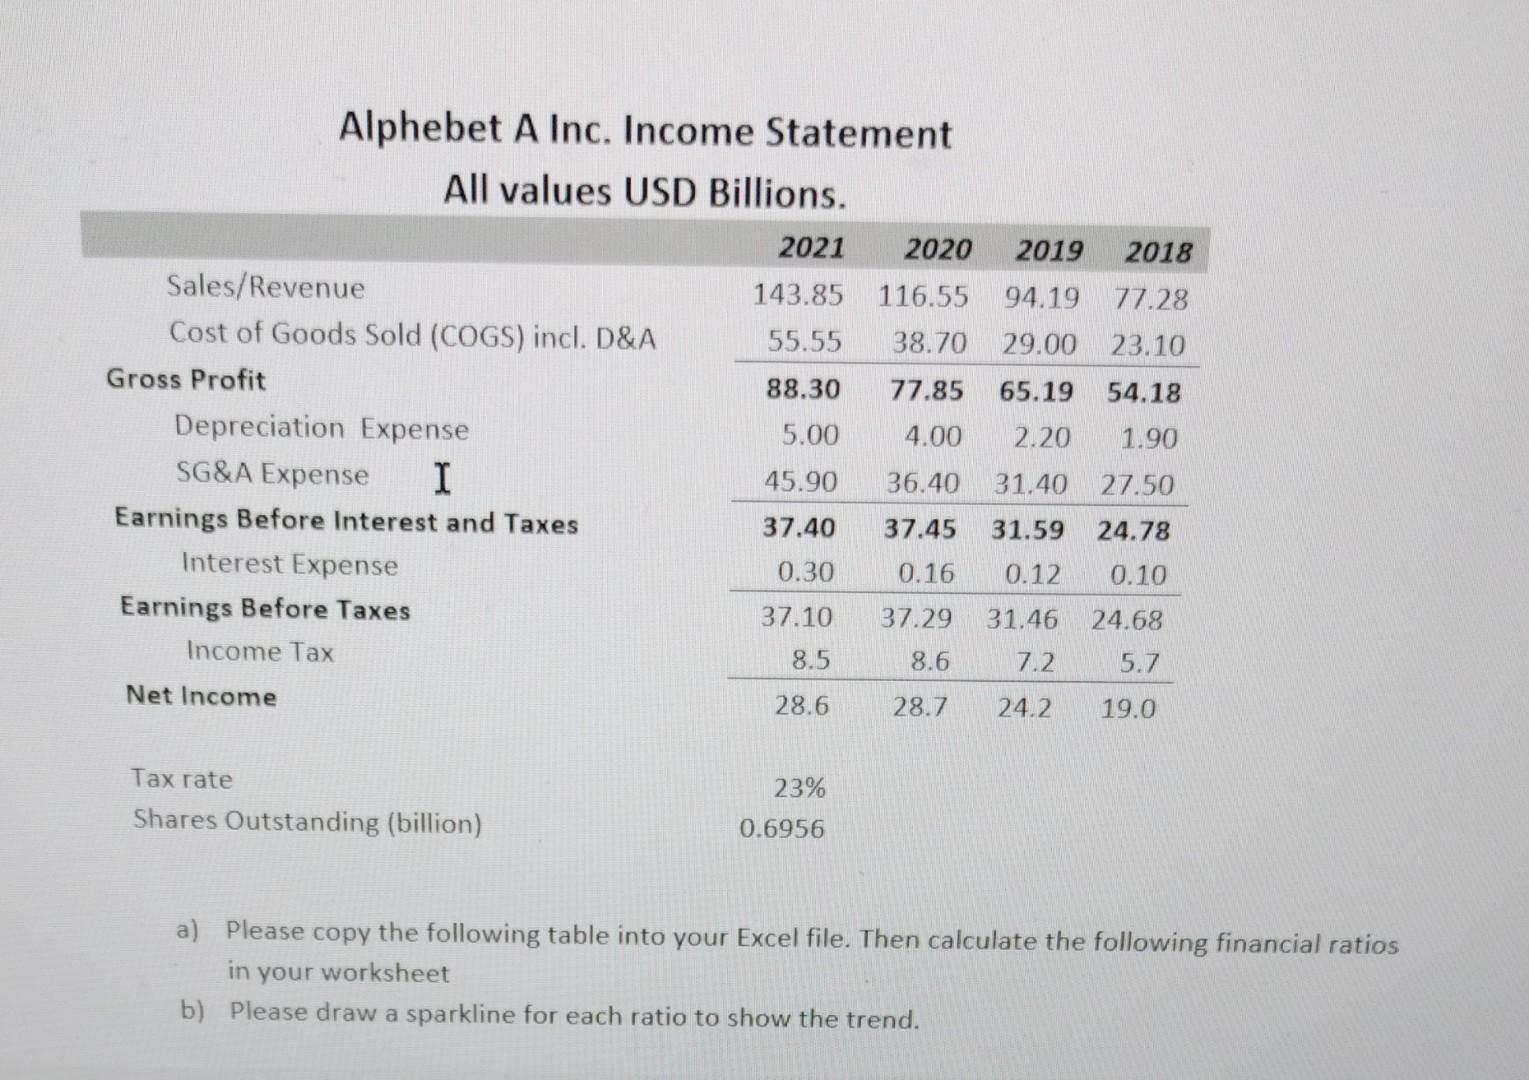
Alphebet A Inc. Income Statement All values USD Billions. 2021202020192018 Sales/Revenue143.85116.5594.1977.28 Cost of Goods Sold (COGS) incl. D&A55.5538.7029.0023.10 Gross Profit88.3077.8565.1954.18 Depreciation Expense5.004.002.201.90 SG&A Expense45.9036.4031.4027.50 Earnings Before Interest and Taxes37.4037.4531.5924.78 Interest Expense0.300.160.120.10 Earnings Before Taxes37.1037.2931.4624.68 Income Tax8.58.67.25.7 Net Income28.628.724.219.0
Tax rate23% Shares Outstanding (billion)0.6956
a)Please copy the following table into your Excel file. Then calculate the following financial ratios in your worksheet b)Please draw a sparkline for each ratio to show the trend. Ratio Analysis for 2018 to 2021 Ratio2021202020192018 Liquidity Ratios Quick Ratio Efficiency Ratios Inventory Turnover Average Collection Period Total Asset Turnover Leverage Ratios LTD to Total Capitalization Debt to Equity Coverage Ratios Times Interest Earned Profitability Ratios Net Profit Margin Return on Total Assets
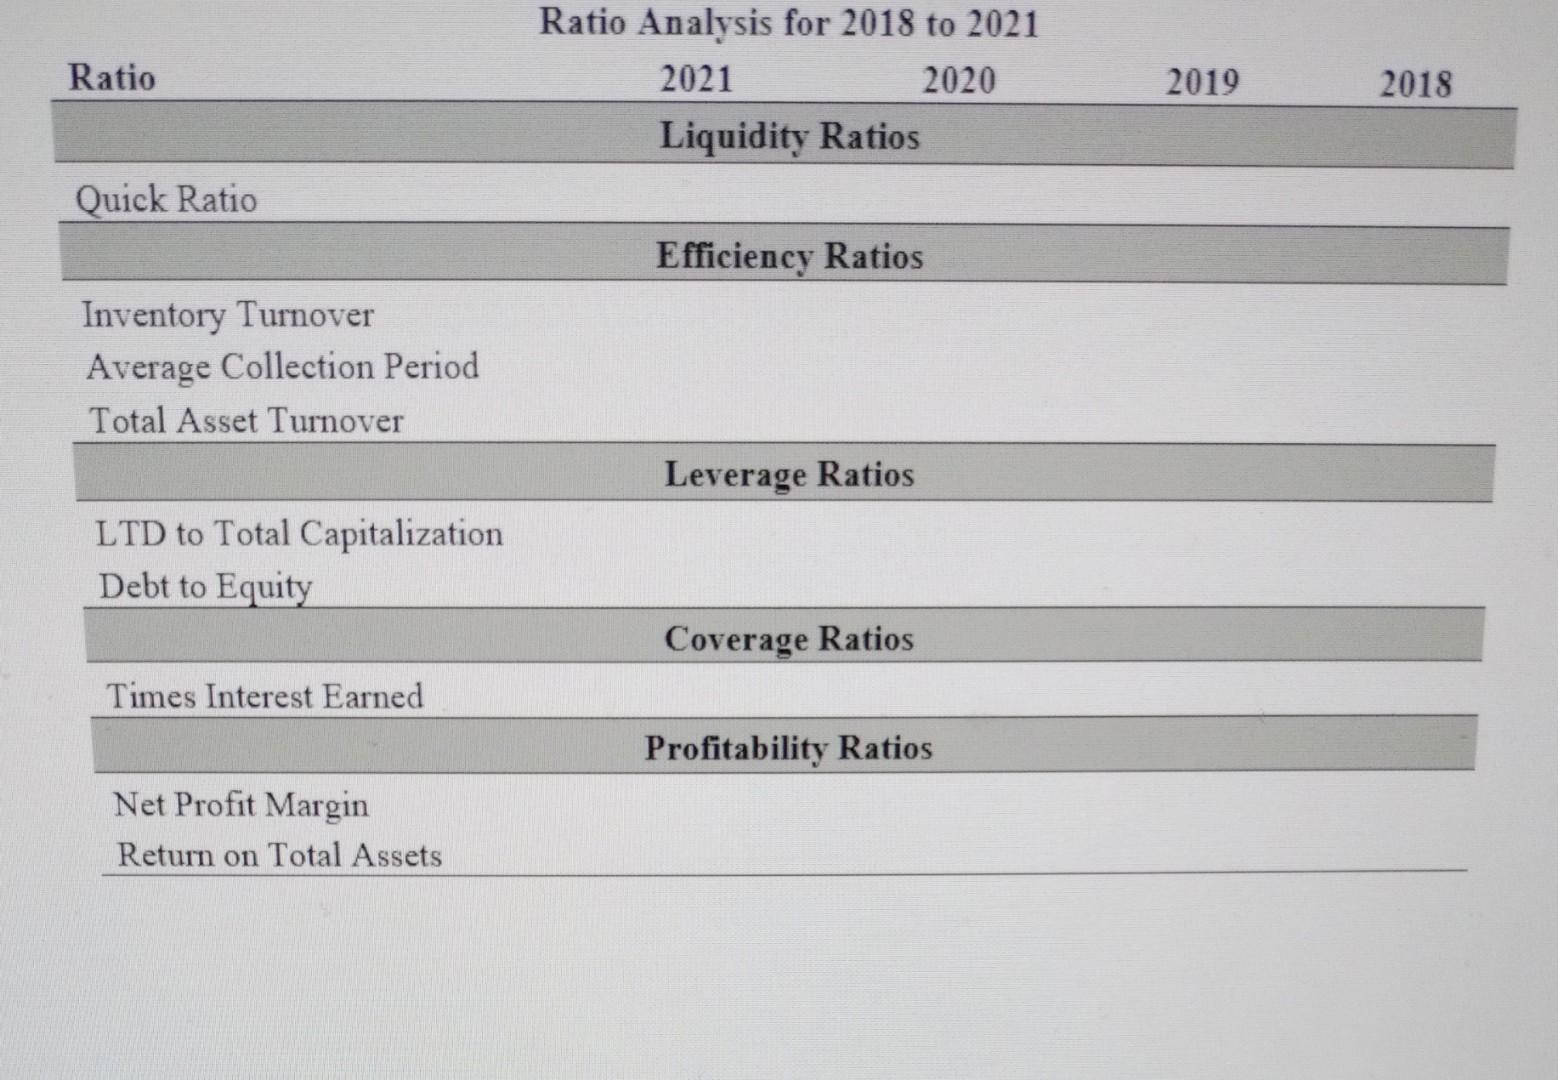
Here are the Balance Sheet and Income Statement of a high-tech company from 2018 to 2021. Please copy them into your Excel file. Alphebet A Inc. Balance Sheet Alphebet A Inc. Income Statement All values USD Billions. a) Please copy the following table into your Excel file. Then calculate the following financial ratios in your worksheet b) Please draw a sparkline for each ratio to show the trend. \begin{tabular}{ccccc} & Ratio Analysis for 2018 to 2021 \\ Ratio & 2021 & 2020 & 2019 & 2018 \\ \hline \multicolumn{4}{c}{ Liquidity Ratios } & \\ \hline \end{tabular} Quick Ratio \begin{tabular}{ll} & Efficiency Ratios \\ \hline Inventory Turnover & \\ Average Collection Period & \\ Total Asset Turnover & Leverage Ratios \\ \hline \end{tabular} LTD to Total Capitalization Debt to Equity Coverage Ratios Times Interest Earned Profitability Ratios Net Profit Margin Return on Total Assets
Step by Step Solution
There are 3 Steps involved in it
Step: 1

Get Instant Access to Expert-Tailored Solutions
See step-by-step solutions with expert insights and AI powered tools for academic success
Step: 2

Step: 3
Ace Your Homework with AI
Get the answers you need in no time with our AI-driven, step-by-step assistance
Get Started