

Question
Here are the draft of my Group Project, title is :The impacts of a well-balanced diet on immunity in combating the COVID-19 virus in various

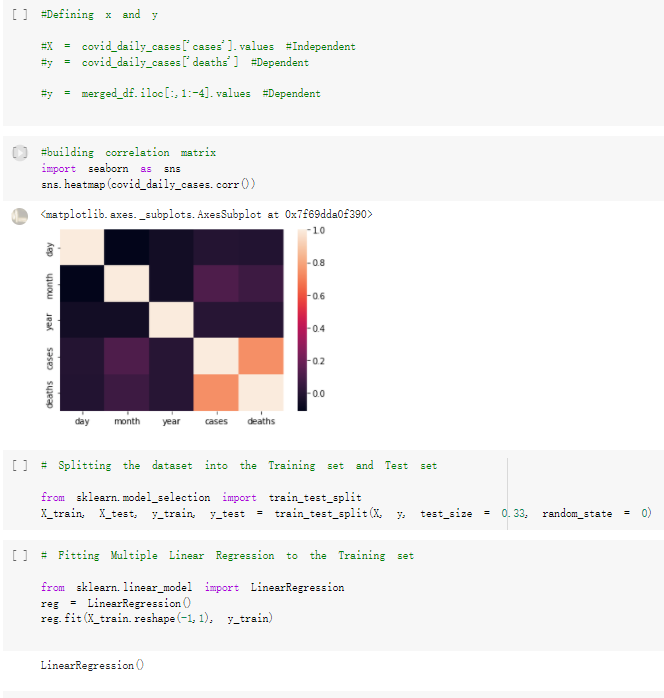
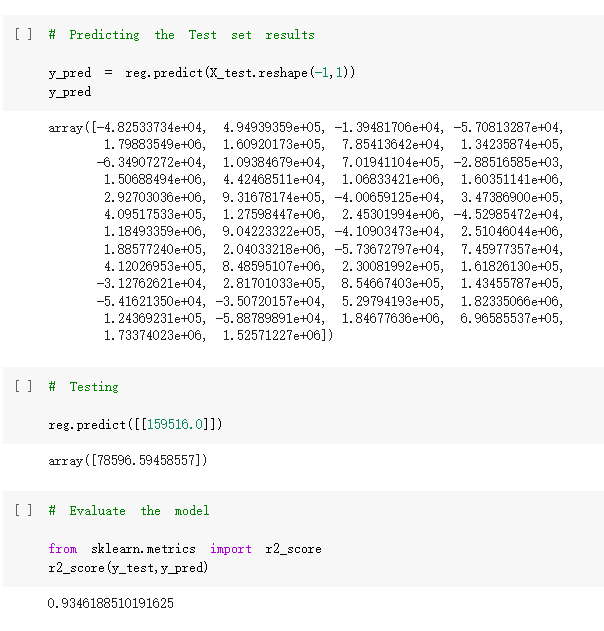
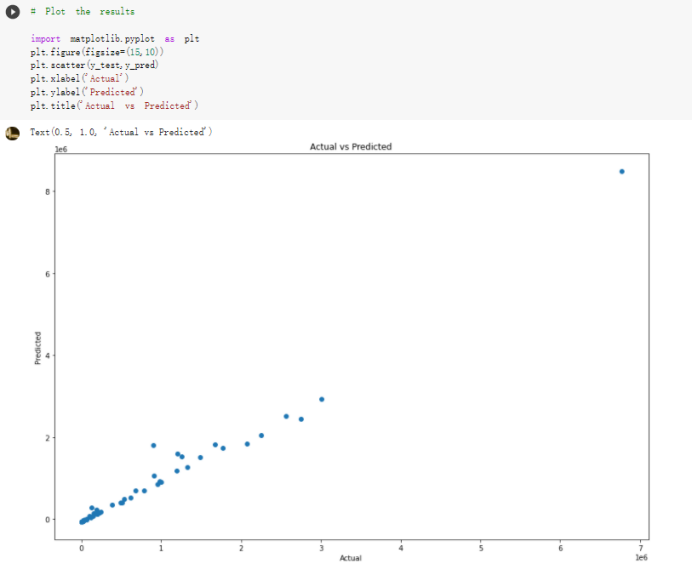
Here are the draft of my Group Project, title is :The impacts of a well-balanced diet on immunity in combating the COVID-19 virus in various countries we are solvong the 3 questions: 1.How many countries adhere to the health authorities' recommendations to consume at least 40% vegetables for a balanced diet? 2.How is the current death and total cases in countries that consume recommended amount of vegetables for their daily intakes as compare to those that doesn't follow the recommendation? 3.What are the predictive COVID-19 trends in countries where sufficient vegetables is consumed?
Please help to point anything we need to improve and help check the modeling part, Thanks
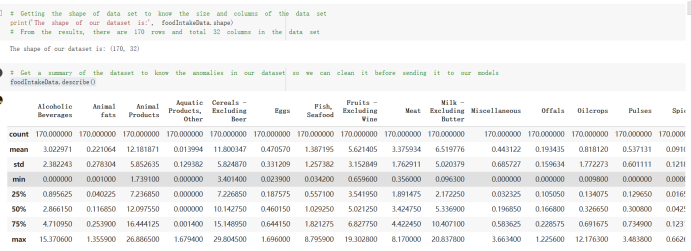
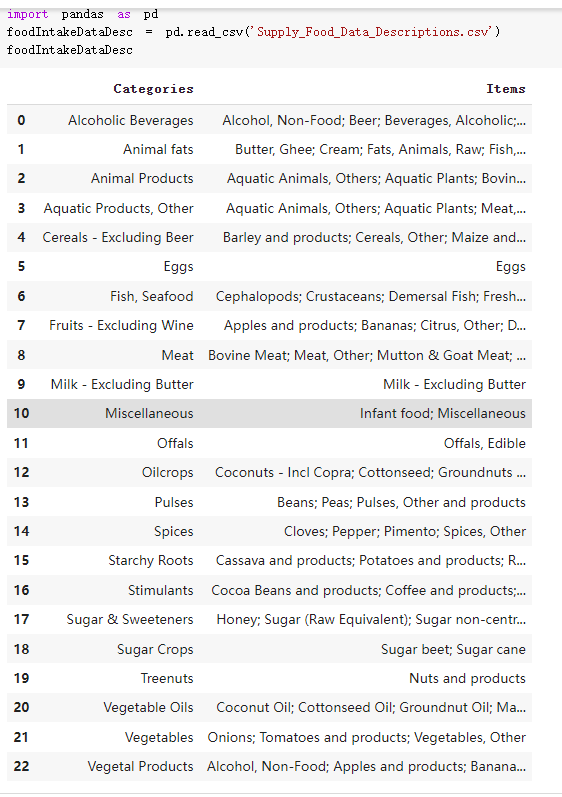
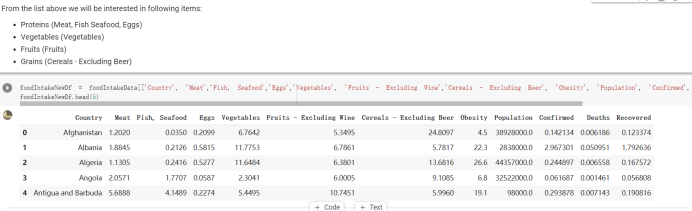
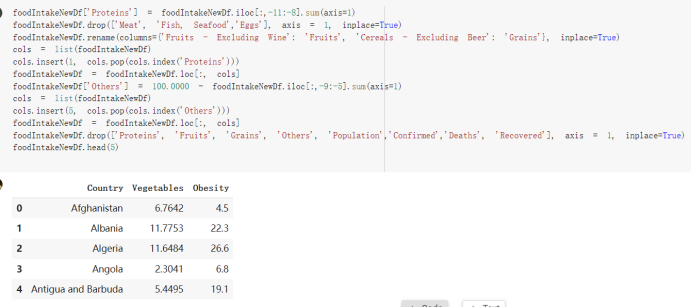
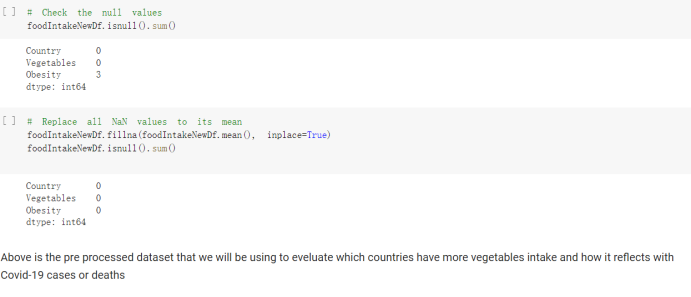
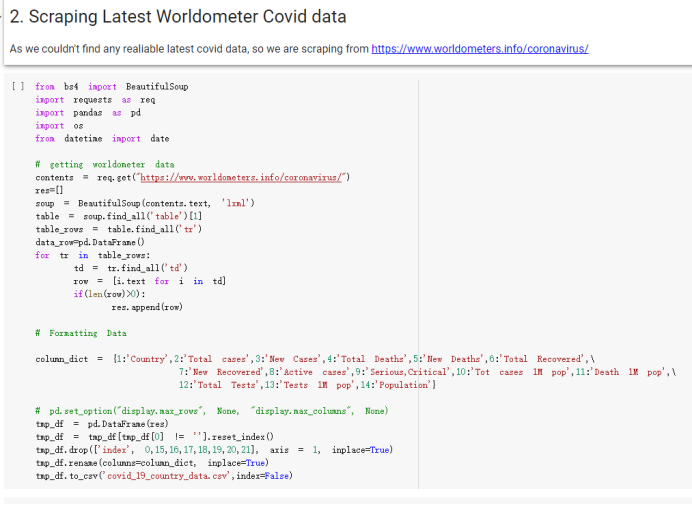
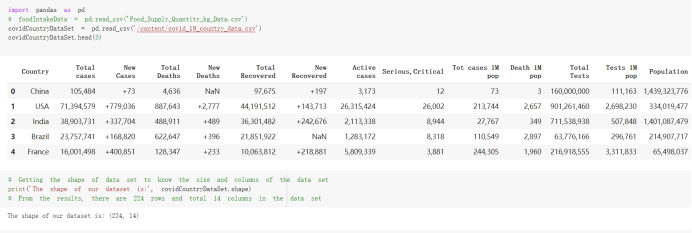
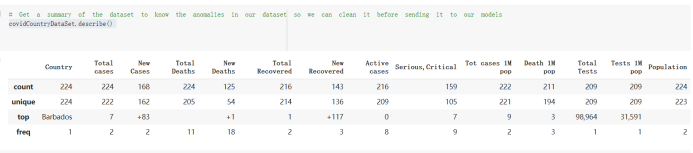
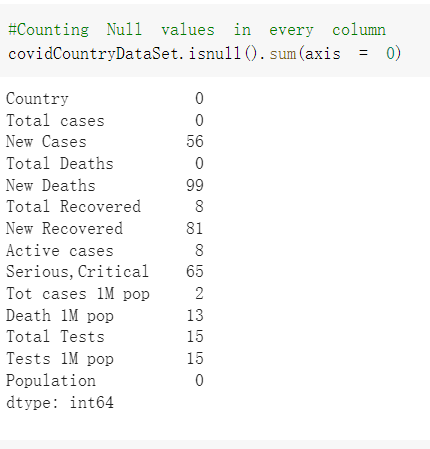
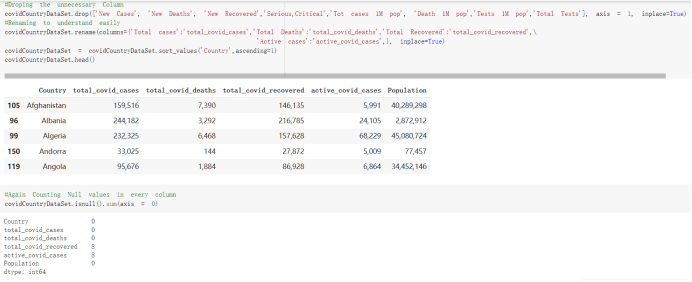
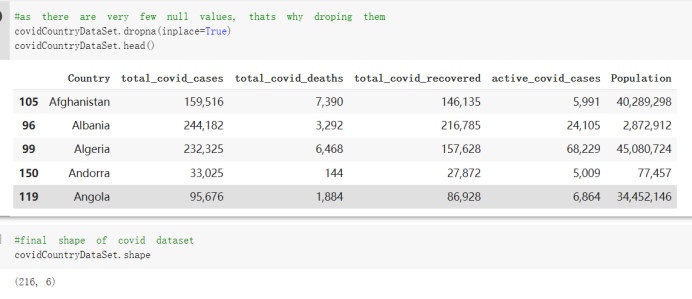
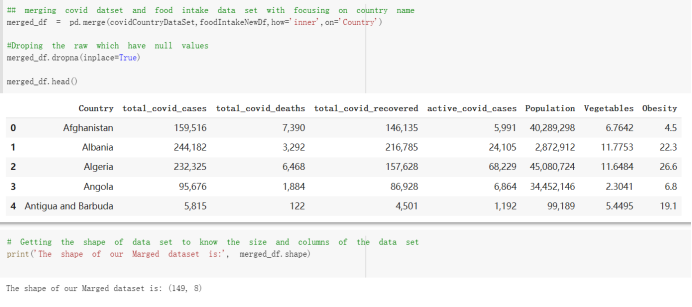
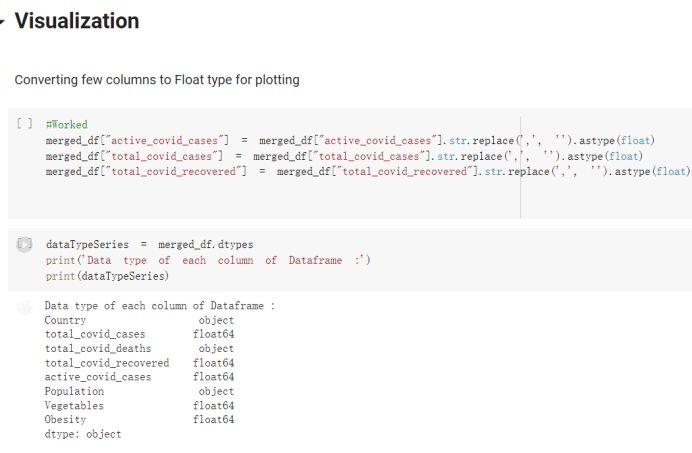
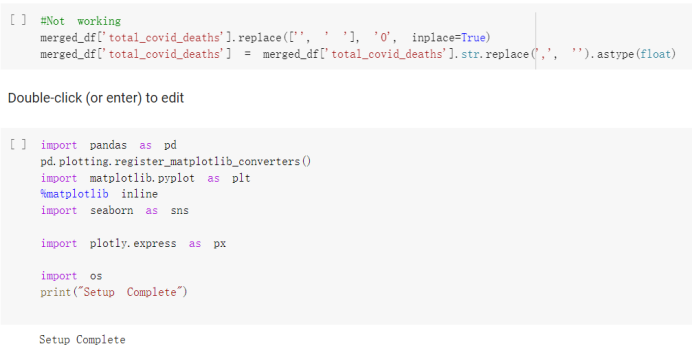
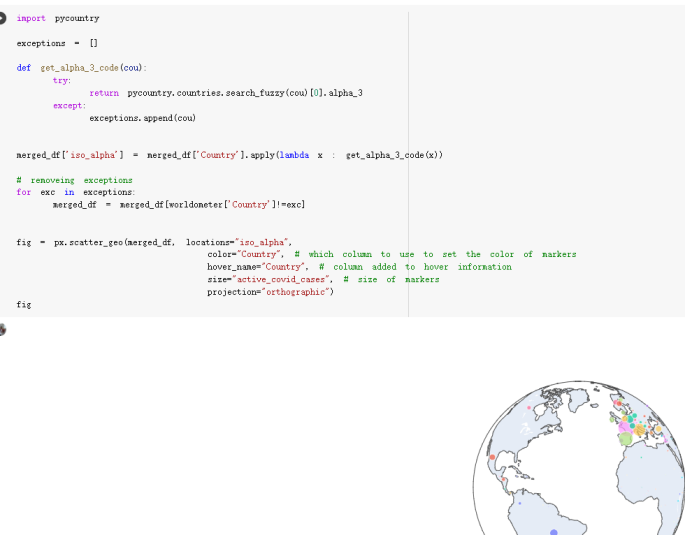
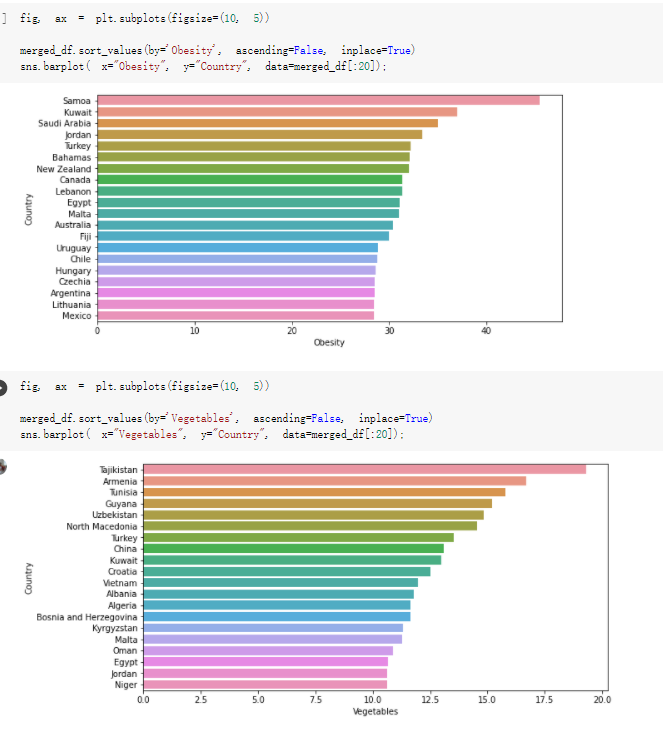
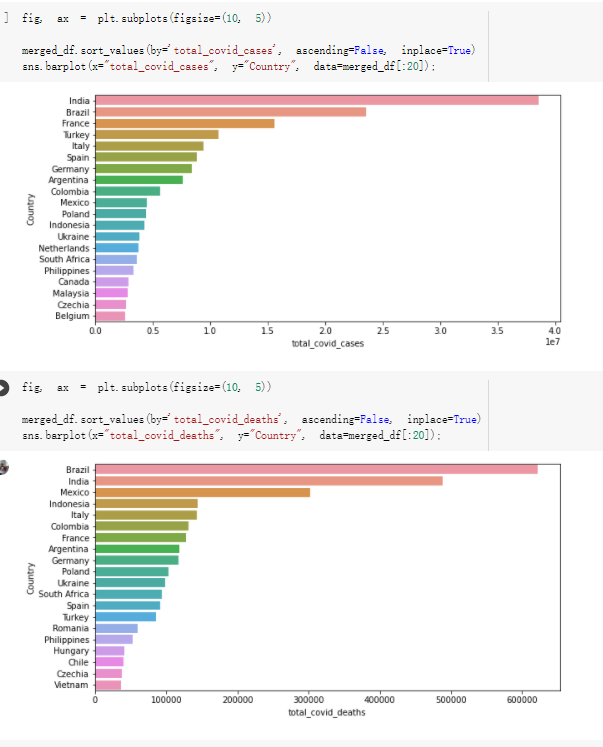
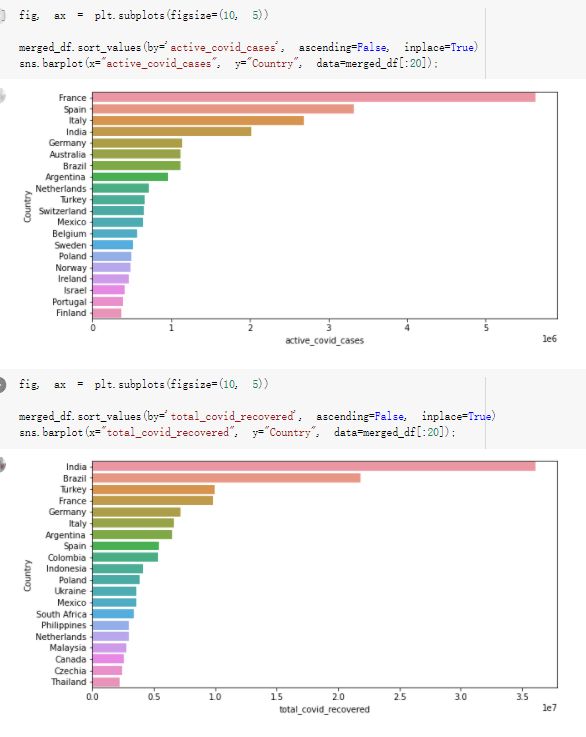
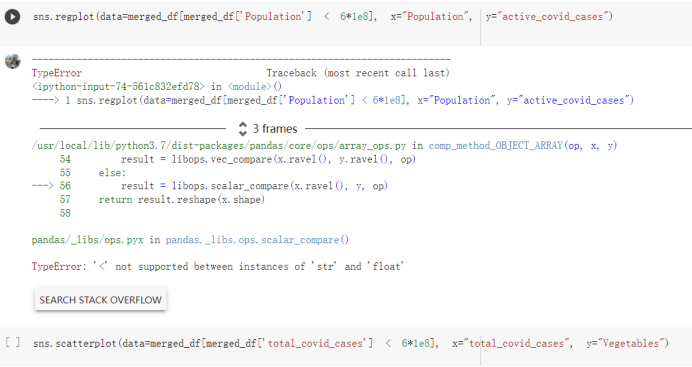
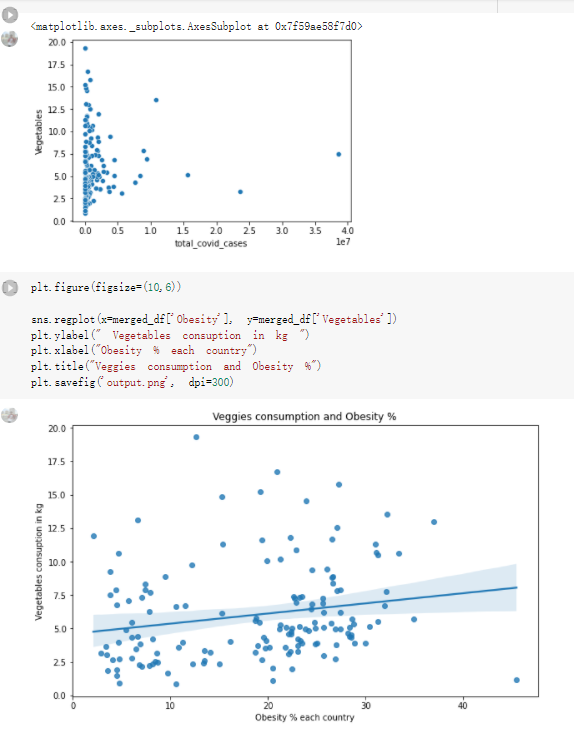
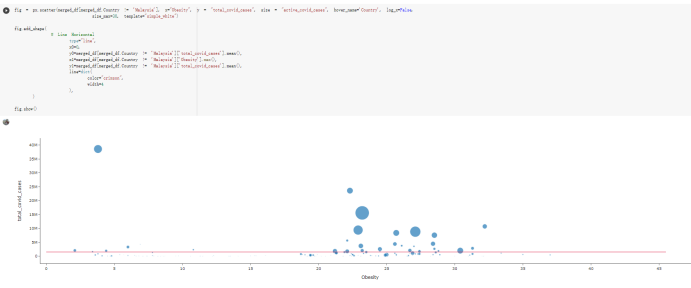
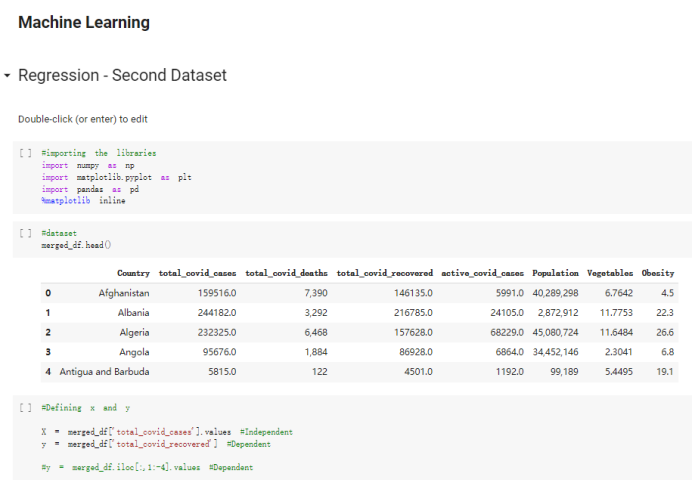
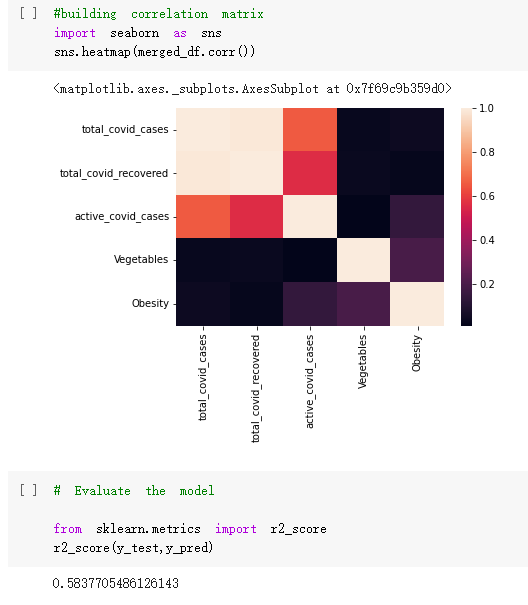
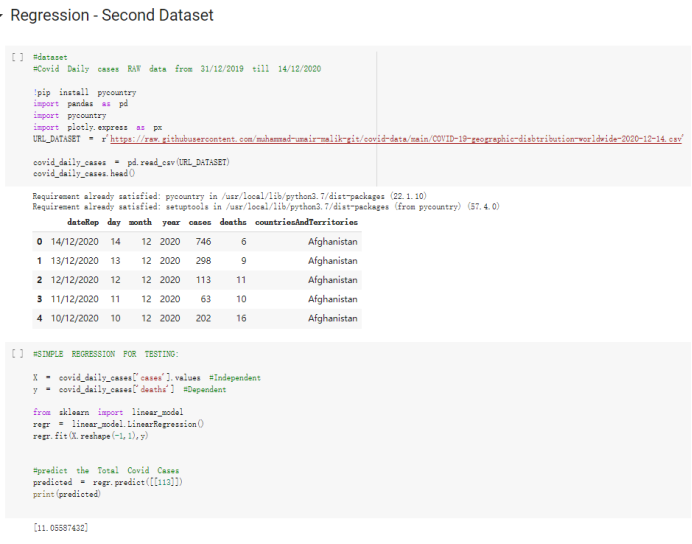
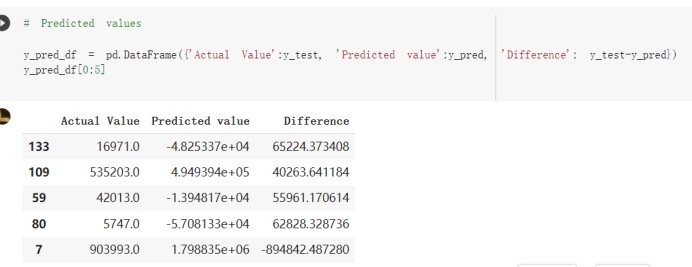
# Predicted values Difference': y_test-y_pred}) y_pred_df = pd. DataFrame (l'Actual Value':y_test, Predicted value':y_pred, y_pred_df [0:5] Actual Value Predicted value Difference 133 16971.0 -4.825337e+04 65224.373408 109 535203.0 4.949394e+05 40263.641184 59 42013.0 -1.394817e+04 55961.170614 80 5747.0 -5.708133e+04 62828.328736 7 903993.0 1.798835e+06 -894842.487280 1 + Getting the shape of data set to know the size and comes of the data set print the shape of our dataset :' food intakut shape) + From the remults, there are 170 rows and total 32 columns in the data set The shape of our data is 170. 32) + Cat ry of the dataset to know the womalies in our dataset can clean it before sending it to our models food Intakellata describe Butter Aquatic Cereals - Alcoholio Animal Animal Fruits - Fish Milk - Excluding Bever Products, Ereluding Products Meat Excluding Miscellaneous offels Seafood Dileres Pulses Spir Other Beer Vine count 170.000000 170.000000 170.000000 170.000000 170.000000 170.000000 170.000000 170.000000 170.000000 170.000000 170.000000 170.000000 170.000000 170.000000 170.000 mean 3.022971 0.221064 12.181871 0.013994 11.800347 0.470570 1.387195 5.621405 3.375934 6.S19776 0.443122 0.193435 0.B18120 0.537131 0.0911 std 2.382243 0.278304 5.852635 0.129382 5.824870 0331209 1.257382 3.152849 1.762911 5.020379 0.685727 0.159634 1.772273 0.601111 0.1211 0.000000 0.001000 1.739100 0.000000 3.401400 0.023900 0.034200 0.659600 0.356000 0.096300 0.000000 0.000000 0.009800 0.000000 0.0001 25% 0.895625 0.040225 7.236850 0.000000 7226850 0.187575 0.557100 3541950 1.891475 2.172250 0.032325 0.105050 0.134075 0.129650 0.016! 50% 2.866150 0.116850 12.097550 0.000000 10.142750 0.460150 1.029250 5.021250 3.424750 5.336900 0.196850 0.166800 0.326650 0.300800 012! 75% 4.710950 0.253900 16.444125 0.001400 15.148950 0644150 1821275 6827750 4.422450 10.407100 0.583625 0228575 0.691675 0.734900 0.123 max 15.370600 1.355900 26.886500 1.679400 29.80500 1.696000 8.795900 19302800 8.170000 20.837800 3.663400 1225600 12.176300 3.483800 0.6621 min pd import pandas as foodIntakeDataDesc foodIntakeDataDesc = pd. read_csv(' Supply_Food_Data_Descriptions.csv') Categories Items 0 1 5 8 9 Alcoholic Beverages Alcohol, Non-Food; Beer; Beverages, Alcoholic... Animal fats Butter, Ghee; Cream; Fats, Animals, Raw; Fish.... 2 Animal Products Aquatic Animals, Others; Aquatic Plants; Bovin... 3 Aquatic Products, Other Aquatic Animals, Others; Aquatic Plants; Meat... 4 Cereals - Excluding Beer Barley and products; Cereals, Other; Maize and... 5 Eggs Eggs 6 Fish, Seafood Cephalopods; Crustaceans; Demersal Fish; Fresh... 7 Fruits - Excluding Wine Apples and products; Bananas; Citrus, Other; D... Meat Bovine Meat Meat, Other; Mutton & Goat Meat; ... Milk - Excluding Butter Milk - Excluding Butter 10 Miscellaneous Infant food; Miscellaneous Offals Offals, Edible 12 Oilcrops Coconuts - Incl Copra; Cottonseed; Groundnuts ... 13 Pulses Beans; Peas; Pulses, Other and products 14 Spices Cloves; Pepper; Pimento; Spices, Other 15 Starchy Roots Cassava and products; Potatoes and products; R... 16 Stimulants Cocoa Beans and products; Coffee and products.... Sugar & Sweeteners Honey; Sugar (Raw Equivalent); Sugar non-centr... 18 Sugar Crops Sugar beet; Sugar cane 19 Treenuts Nuts and products 20 Vegetable Oils Coconut oil; Cottonseed Oil; Groundnut Oil; Ma... 21 Vegetables Onions; Tomatoes and products; Vegetables, Other Vegetal Products Alcohol, Non-Food; Apples and products; Banana... 11 17 22 From the list above we will be interested in following items: Proteins (Meat Fish Seafood, Eggs) Vegetables (Vegetables) Fruits (Fruits) Grains (Cereals. Excluding Beer) food stakaavde = foodatakaDatal'Country", "hot", "Fish, Seafood', 'Eers","Vepotables', 'Fruits - Excluding Vine", "Cereals Exeluding Bear'. 'Obesity', "Population', 'Confirmed'. foodata.head (5) Country Meat Fish, Seafood Fees Vegetables Fruits - Exeluding Wine Cereals - Excluding Beer Obesity Population Confirmed Deaths Recovered 0 Afghanistan 1.2020 0.0350 0.2090 6.7642 5.3495 24.8097 4.5 39928000.0 0.142134 0.006186 0.123374 1 Albania 18945 02126 0.5815 11.7753 6.7861 5.7817 22.3 2839000.0 2.967301 0.050951 1.792636 2 Algeria 1.1305 02416 0.5277 11.6484 6.3801 13,6816 26.6 44357000.0 0.244597 0.006558 0.167572 3 Angola 20571 1.7707 0.0587 2.3041 6.0005 9.1065 68 325220000 0.061687 0.001461 0.056808 4 Antigua and Barbuda 5.6888 4.1489 02274 54495 10.7451 5.9960 19.1 98000.0 0.293878 0.007143 0.190816 + Code Text foodIntakeNewDf l' Proteins'] = food IntakeNewDf. iloc:, -11:-8). sun (axis=1) foodIntakeNewDf. drop (I'Meat', 'Fish, Seafood', 'Eges'), axis = 1, inplace=True) food IntakeNewDf. renane (columns='' Fruits - Excluding Wine': 'Fruits', 'Cereals - Excluding Beer': 'Grains'], inplace=True) cols = list (food IntakeNewDE) cols, insert (1, cols, pop (cols, index (Proteins'))) foodIntakeNew = foodIntakeNewDf. loc: cols) foodIntakeNewDf l' Others'] = 100.0000 - food IntakeNewDf. iloc[:, -9:-5), sun (axis=1) cols = list (food IntakeNewDE) cols. insert (5, cols. pop (cols. index ("Others'))) foodIntakeNewDf = foodIntakeNewDf. loc(:, cols) foodIntakeNexDf. drop (I Proteins", "Fruits', 'Grains', 'Others', 'Population', 'Confirmed' , ' Deaths', 'Recovered' ], axis = 1, inplace=True) foodIntakeNewDf. head (5) 45 Country Vegetables Obesity 0 Afghanistan 6.7642 1 Albania 11.7753 22.3 2 Algeria 11.6484 26.6 3 Angola 2.3041 6.8 4 Antigua and Barbuda 5.4495 19.1 [] # Check the null values food IntakeNewDf. isnullo. sumo 0 0 Country Vegetables Obesity dtype: int64 [] # Replace all NaN values to its mean food IntakeNewDf. fillna (foodIntakeNewDf. mean, inplace=True) foodIntakeNewDf. isnul10. sumo Country Vegetables Obesity dtype: int64 0 0 0 Above is the pre processed dataset that we will be using to eveluate which countries have more vegetables intake and how it reflects with Covid-19 cases or deaths 2. Scraping Latest Worldometer Covid data As we couldn't find any realiable latest covid data, so we are scraping from https://www.worldometers.info/coronavirus/ [ from bs4 inport BeautifulSoup inport requests as req inport pandas as pd import 08 fron datetine inport date # getting worldoneter data contents = req.get("https://www.worldoneters. info/coronavirus/) Tes=[] soup = BeautifulSoup (contents. text, 'linl') table = soup.find_all('table')[1] table_rous = table.find_all('tr') data_zow pd. DataFrame() for trin table_rows: td = tr.find_all('td') TOW = [i. text for i in td] if(len (ov) YO): res. append (wow) # Formatting Data colunn_diet = {1:' Country', 2:'Total cares', 3:'New Cases', 4:' Total Deathe, 5: New Deaths", 6:' Total Recovered', 1 7: Ne Recovered', 8:'Active cases',9: Serious, Critical', 10:' Tot cases 11 pop', 11:'Death 11 pop', 12:'Total Testa', 13:"Tests Il pop', 14:' Population'] # pd. set_option("display. nax_rovs", None, "display, nax_columns, None) top_df = pd. DataFrane (res) tmp_df = tap_df (tmp_df [0] != "").reset_index() tnp_df. drop(l'inder', 0, 15, 16, 17, 18, 19, 20, 21), aris = 1, inplace=True) tmp_df.renane (colunns=colunn_dict, inplace=True) tmp_df.to_csv ('covid_19_country_data.csv", index=False) import pandas a pd food Intaketa - pd. read ov('Food Suroly Quantitrke Data, sy') covidCountryDataSet - pd. read_ove" content.col_19_county_data.csv') coridCountryDataSet. head (5) Total Deuth New Deaths Serious, Critical Pop 0 Total New Country Case Cases China 105,484 +73 USA 71,194,579 +779,036 India 38,903,731 +337,704 Brazil 23,757,741 +168,820 France 16,001,498 +400,851 Total Recovered 97,675 44,191,512 4,636 887,643 1 12 26,002 New Active Recovered +197 3,173 +143,71326,315,424 +242,676 2.113,336 NaN 1,283,172 +218,881 5,809,339 NaN +2777 +489 + 396 Tot cases 1 Death IM Total pop Tests 73 3 160,000,000 213.744 2,657901261,460 27,767 349 711,538,938 110,549 2,897 63,776,166 244 305 1,960 216,918555 Tests M Population pop 111,163 1,439,323,776 2,698,230 334,019,477 507,848 1401,067479 296,761 214,907,717 3,311,833 65,498,037 2 8,944 3 488,911 622,647 128,347 36,301,482 21,851,922 10,063,812 8,318 3,881 4 +233 Getting the shape of data set to know the size and columns of the data set print (The shape of our dataset is:', coridCountryOntaSet shape) + from the results, there are 224 70 and total 14 columns in the data set The shape of our dataset 1234, 14 = Get a summary of the dataset to know the anomalies in our dataset some can clean it before sending it to our models covidCountry DataSet describe Total New Country New Deaths Serious, Critical Total Deaths 224 Total Recovered 216 Population New Recovered 143 Total Tests Active cases 216 Death IN pop Tot cases 1M pop 222 Tests 1 POD 209 count 224 224 168 125 159 211 209 224 224 162 205 54 214 136 209 105 221 194 209 209 223 unique top 222 7 Barbados +83 +1 1 0 7 9 3 98.964 31,591 1 2 2 11 18 2 3 9 2 3 1 1 2 #Counting Null values in every column covidCountryDataSet. isnull(). sum (axis = 0) 0 0 56 Country Total cases New Cases Total Deaths New Deaths Total Recovered New Recovered Active cases Serious, Critical Tot cases 1M pop Death 1M pop Total Tests Tests 1M pop Population dtype: int64 0 99 8 81 8 65 2 13 15 15 0 Droping the necessary Column bidCountry Data Set drop ( Cases, Nux Death', Nux Recovered', 'Serious, Critical', 'Tot cases 1% popDeath IM pop'. 'Tests 1% pop', 'Total Tests'), axis = 1. inplueTrue) Bening to understand easily covi Counters Data Set res columns='Total cases":"total_covid_cases', 'Total Deaths":"total_covid_deaths', 'Total Recovered":"total_covidrecovered', Active cases' 'active_covid_cases, l, relacruel covi Country DataSet = covi Country DataSet sort_values' Country, ascending=l) covi Country DataSet.heado 146,135 Country total_covid cases total_oovid deaths total_covid recovered active_covid_cases Population 105 Afghanistan 159,516 7,390 5,991 40.289,298 96 Albania 244,182 3.292 216,785 24.105 2872,912 99 Algeria 232,325 6,468 157628 68.229 45.080,724 150 Andorra 33.025 144 27 872 5.009 77,457 119 Angola 95,676 1,884 86,928 6.864 34452 146 Higais Counting Mall values in every column covidCountry Data Setiamall 0.1mlaxis = 0) Country total_covid_case total_covid_deaths total_covidrecovered active_covid.cases Population dtype: int64 #as there are very few null values, thats why droping them covidCountryDataSet dropna (inplace=True) covidCountryDataSet. head() Country total_covid_cases total_covid_deaths total_covid recovered active_covid_cases Population 105 Afghanistan 159,516 7,390 146,135 5,991 40,289,298 96 Albania 244,182 3,292 216,785 24,105 2,872,912 99 Algeria 232,325 6,468 157,628 68,229 45,080,724 150 Andorra 33,025 144 27,872 5,009 77,457 119 Angola 95,676 1,884 86,928 6,864 34,452,146 #final shape of covid dataset covidCountryDataSet, shape (216, 6) merging covid datset and food intake data set with focusing on country name merged_df = pd. merge (covidCountryDataSet, food IntakeNewf,how=' inner', on='Country) Droping the raw which have null values merged_df. dropna (inplace=True) merged_df. head Country total_covid_cases total_covid_deaths total_covid recovered active_covid_cases Population Vegetables Obesity 0 Afghanistan 159,516 7,390 146,135 5,991 40,289,298 6.7642 4.5 1 Albania 244,182 3,292 216,785 24,105 2,872,912 11.7753 223 2 Algeria 232,325 6,468 157,628 68,229 45,080,724 11.6484 26.6 3 Angola 95,676 1,884 86,928 6,864 34,452,146 2.3041 6.8 4 Antigua and Barbuda 5,815 122 4,501 1,192 99,189 5.4495 19.1 # Getting the shape of data set to know the size and columns of the data set print('The shape of our Marged dataset isi', merged_df. shape) The shape of our Marged dataset is: (149, 8) - Visualization Converting few columns to Float type for plotting [ ] Worked merged_df ["active_covid_cases"] = merged_dfb"active_covid_cases"]. str.replace(',': "').astype (float) merged_df ["total_covid_cases"] = merged_df ["total_covid_cases").str. replace(',', ). astype (float) merged_df ["total_covid_recovered"] = merged_df ["total_covid_recovered"). str.replace(',', "). astype (float) dataTypeSeries = merged_df.dtypes print (Data type of each column of Dataframe :) print (dataTypeSeries) Data type of each column of Dataframe : Country object total_covid_cases float64 total_covid_deaths object total_covid_recovered float64 active_covid_cases float64 Population object Vegetables float64 Obesity float64 dtype: object [] #Not working merged_df l' total_covid_deaths').replace(["', ''), '0', inplace=True) merged_df ['total_covid_deaths'] = merged_df l' total_covid_deaths'). str.replace(','; "). astype (float) Double-click (or enter) to edit [] import pandas as pd pd. plotting, register_matplotlib_converters) import matplotlib. pyplot as plt Tomatplotlib inline import seaborn as sns import plotly, express as import os print("Setup Complete") Setup Complete inport Pycountry exceptions - D def get_alpha_3_code (cou) try: return pycountry.countries. Search_fuzzy (cou) [o). alpha_3 except: exceptions.append(cou) get_alpha_3_code(x)) nerged_df l' iso_alpha') - nerged_df ["Country').apply(lambda x # renoveing exceptions for exc in exceptions: merged_df - merced_df (worldonoter l' Country']!-exc] fig- px. scatter_geo (nerged_df, locations-"iso_alpha", color="Country", # which column to use to set the color of markers hover_nane="Country", # column added to hover information size="active_covid_cases", # size of narkers projection='orthographic"> fig fig 2x = plt. subplots (figsize= (10.5)) merged_df. sort_values (by='Obesity'. ascending=False inplace=True) sns. barplot( x="Obesity". y="Country" data-merged_df[:20]): Country Samoa Kuwait Saudi Arabia Jordan Turkey Bahamas New Zealand Canada Lebanon Egypt Malta Australia Fiji Uruguay Chile Hungary Czechia Argentina Lithuania Mexico 10 20 Obesity ax = plt. subplots (figsize= (10.5)) merged_df. sort_values (by=" Vegetables', ascending=False. inplace=True) sns, barplot( x="Vegetables", y="Country". data=merged_df[:20]): Country Tajikistan Armenia Tunisia Guyana Uzbekistan North Macedonia Turkey China Kuwait Croatia Vietnam Albania Algeria Bosnia and Herzegovina Kyrgyzstan Malta Oman Egypt Jordan Niger 0.0 2.5 5.0 7.5 12.5 15.0 17.5 20.0 10.0 Vegetables ] fis ex = plt. subplots (figsize= (10.5)) merged_df. sort_values (by="total_covid_cases', ascending=False, inplace=True) sns. barplot G="total_covid_cases", y="Country". data-perged_dft:20]): Country India Brazil France Turkey Italy Spain Germany Argentina Colombia Mexico Poland Indonesia Ukraine Netherlands South Africa Philippines Canada Malaysia Czechia Belgium 0.0 05 10 15 25 30 3.5 20 total_covid_cases 4.0 le7 fig ax = plt. subplots (figsize= (10.5)) merged_df. sort_values (by="total_covid_deaths", ascending=False inplace=True) sns. barplot G="total_covid_deaths", ="Country". data=merged_df[:20]): Country Brazil India Mexico Indonesia Italy Colombia France Argentina Germany Poland Ukraine South Africa Spain Turkey Romania Philippines Hungary Chile Czechia Vietnam 0 100000 200000 500000 600000 300000 400000 total_covid_deaths ) fig ex = plt. subplots (figsize= (10.5)) merged_df. sort_values (by="active_covid_cases", ascending=False inplace=True) ans. barplot (x="active_covid_cases", y="Country". data=merged_df[:20]): Country France Spain Italy India Germany Australia Brazil Argentina Netherlands Turkey Switzerland Mexico Belgium Sweden Poland Norway Ireland Israel Portugal Finland active_covid_cases le6 fig plt. subplots (figsize= (10.5)) merged_df. sort_values (by="total_covid_recovered, ascending=False inplace=True) sns. barplot (="total_covid_recovered". ;="Country". data=merged_df[:20]): Country India Brazil Turkey France Germany Italy Argentina Spain Colombia Indonesia Poland Ukraine Mexico South Africa Philippines Netherlands Malaysia Canada Czechia Thailand 0.0 20 0.5 10 2's 25 3.0 15 20 total_covid_recovered 35 le7 sns. rezplot (data=merged_df [merged_df [' Population') inStep by Step Solution
There are 3 Steps involved in it
Step: 1

Get Instant Access to Expert-Tailored Solutions
See step-by-step solutions with expert insights and AI powered tools for academic success
Step: 2

Step: 3
Ace Your Homework with AI
Get the answers you need in no time with our AI-driven, step-by-step assistance
Get Started
SQL FOR BEGINNERS THE FUNDAMENTAL LANGUAGE FOR DATA SCIENCE TO MASTERING DATABASES AN ESSENTIAL GUIDE YOU CANNOT MISS TO LEARN SQL IN 7 DAYS OR LESS WITH HANDS ON PROJECTS
Authors: ERICK THOMPSON
1st Edition
B08KGT7GG2, 979-8686327658