Answered step by step
Verified Expert Solution
Question
1 Approved Answer
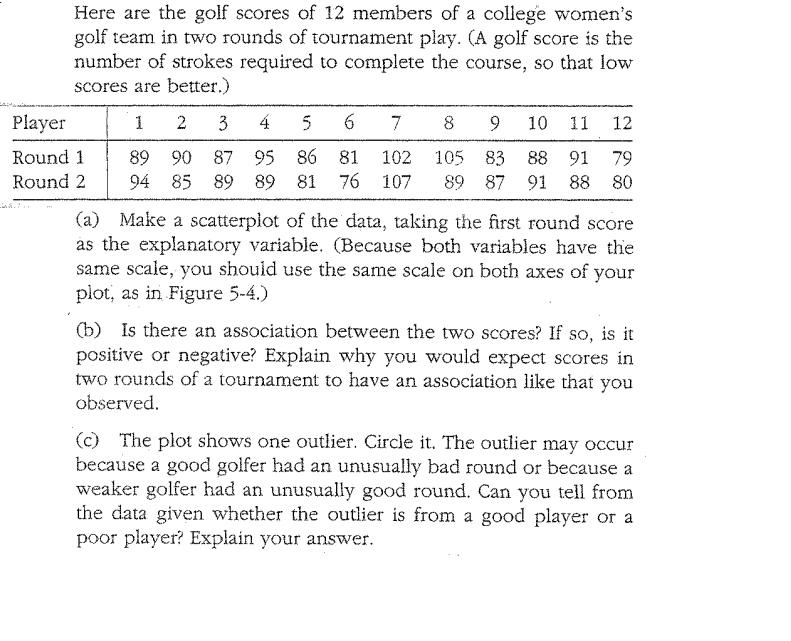
Here are the golf scores of 12 members of a college women's golf team in two rounds of tournament play. (A golf score is

Here are the golf scores of 12 members of a college women's golf team in two rounds of tournament play. (A golf score is the number of strokes required to complete the course, so that low scores are better.) 1 2 3 4 5 6 7 8 9 10 11 12 89 90 87 95 86 81 102 105 83 88 91 79 94 85 89 89 81 76 107 89 87 91 88 80 Player Round 1 Round 2 (a) Make a scatterplot of the data, taking the first round score as the explanatory variable. (Because both variables have the same scale, you should use the same scale on both axes of your plot, as in Figure 5-4.) (b) Is there an association between the two scores? If so, is it positive or negative? Explain why you would expect scores in two rounds of a tournament to have an association like that you observed. (c) The plot shows one outlier. Circle it. The outlier may occur because a good golfer had an unusually bad round or because a weaker golfer had an unusually good round. Can you tell from the data given whether the outlier is from a good player or a poor player? Explain your answer.
Step by Step Solution
★★★★★
3.43 Rating (159 Votes )
There are 3 Steps involved in it
Step: 1
Answer a Go to excel type data select the data column of r1 and r2 insert sc...
Get Instant Access to Expert-Tailored Solutions
See step-by-step solutions with expert insights and AI powered tools for academic success
Step: 2

Step: 3

Ace Your Homework with AI
Get the answers you need in no time with our AI-driven, step-by-step assistance
Get Started


