Here are the scores of 13 students on a history test. 59, 62, 63, 65, 66, 73, 75, 75, 78, 79, 79, 93, 95 Notice
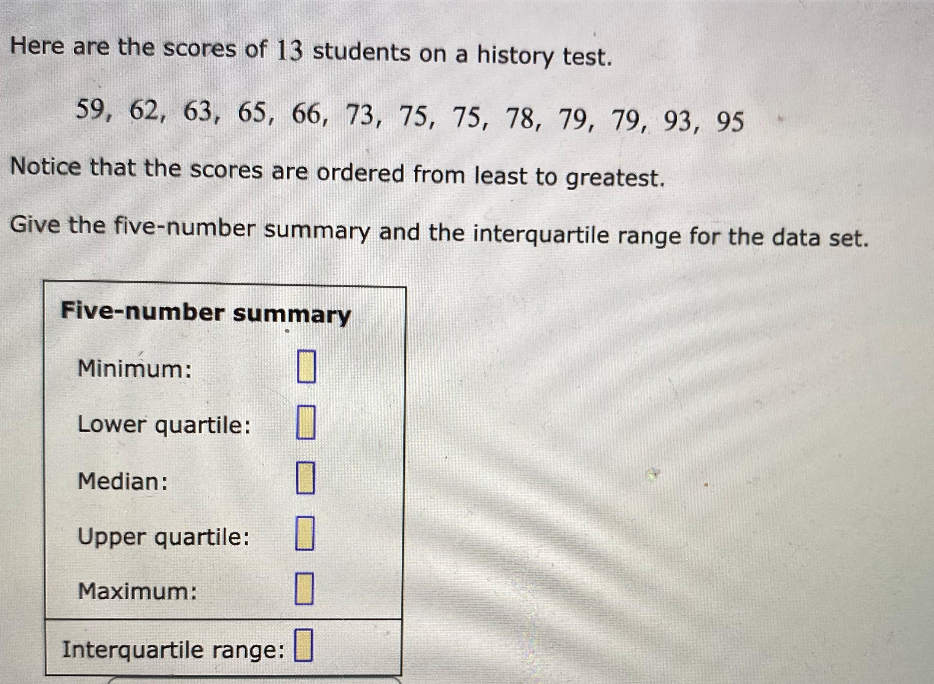
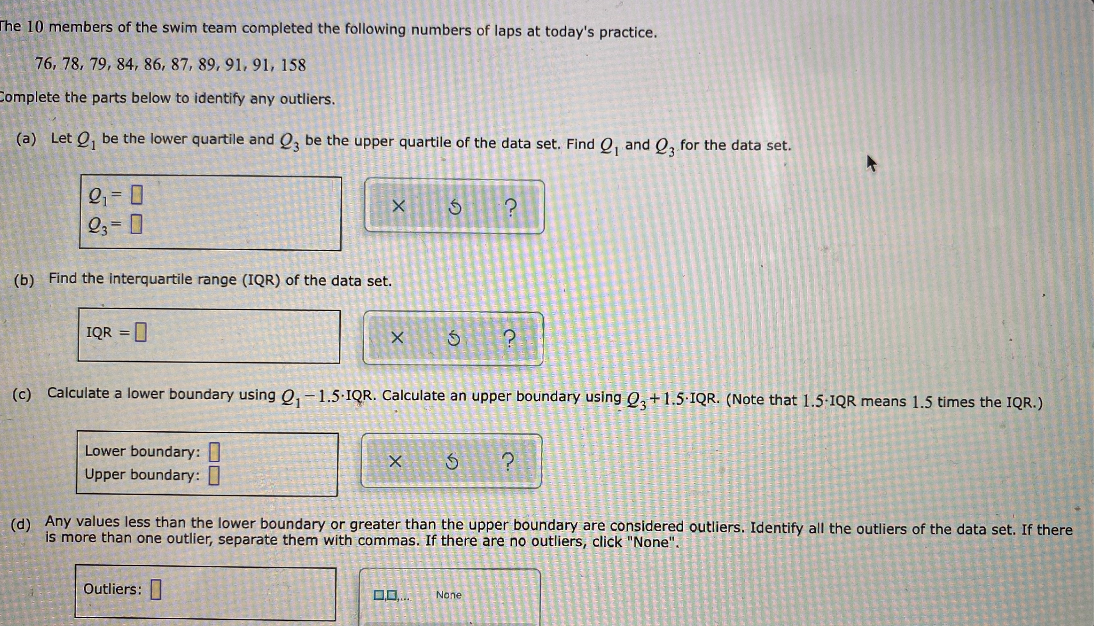
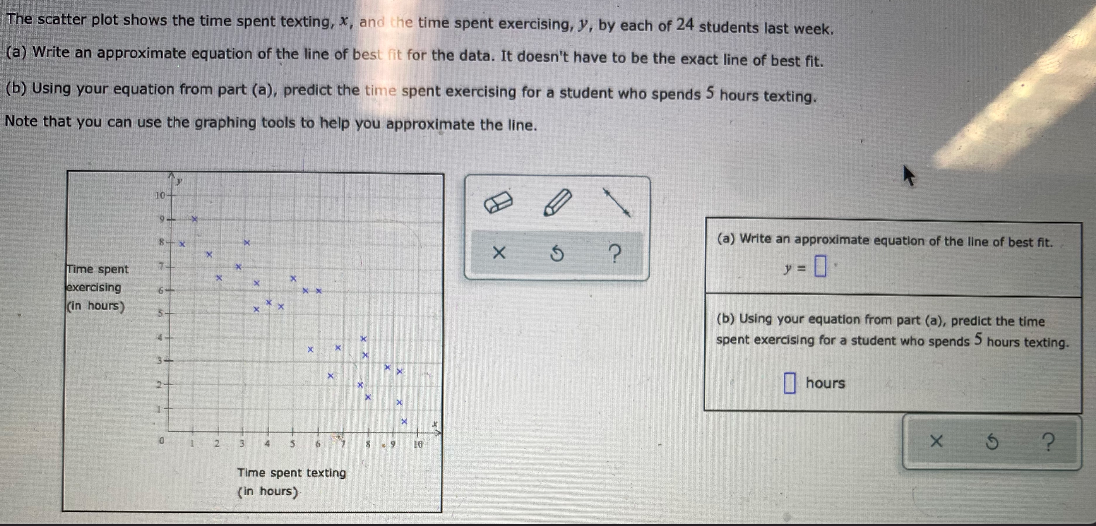
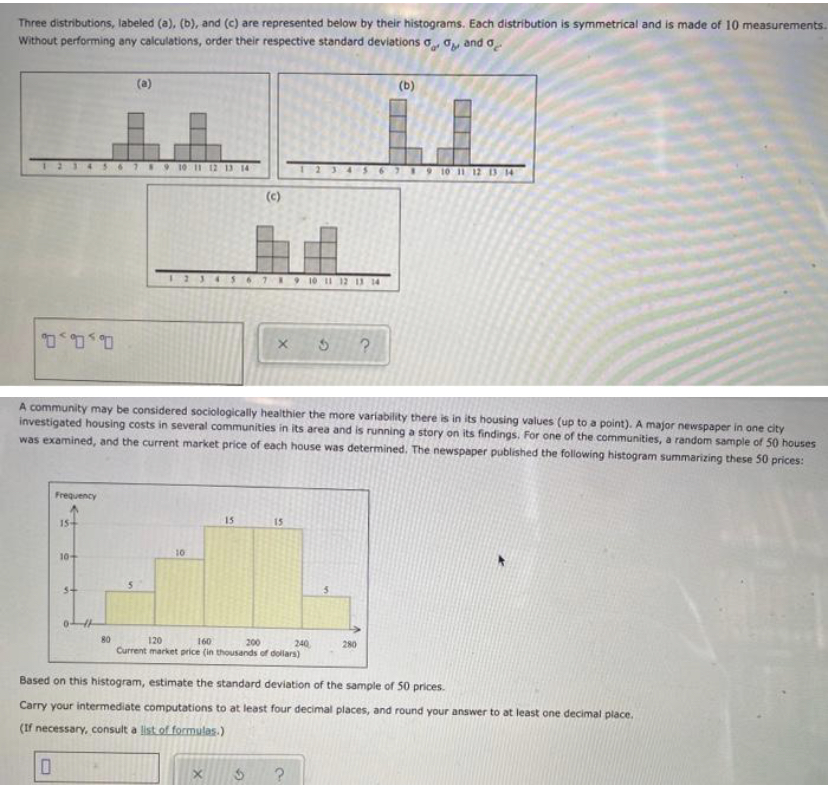
Here are the scores of 13 students on a history test. 59, 62, 63, 65, 66, 73, 75, 75, 78, 79, 79, 93, 95 Notice that the scores are ordered from least to greatest. Give the five-number summary and the interquartile range for the data set. Five-number summary Minimum: Lower quartile: Median: O Upper quartile: Maximum: Interquartile range:The 10 members of the swim team completed the following numbers of laps at today's practice. 76, 78, 79, 84, 86, 87, 89, 91, 91, 158 Complete the parts below to identify any outliers. (a) Let Q, be the lower quartile and Q3 be the upper quartile of the data set. Find O, and O, for the data set. 21= 0 X ? (b) Find the interquartile range (IQR) of the data set. IQR = X ? (c) Calculate a lower boundary using Q, - 1.5.IQR. Calculate an upper boundary using Q, +1.5.IQR. (Note that 1.5.IQR means 1.5 times the IQR.) Lower boundary: X Upper boundary: I (d) Any values less than the lower boundary or greater than the upper boundary are considered outliers. Identify all the outliers of the data set. If there is more than one outlier, separate them with commas. If there are no outliers, click "None". Outliers: NoneThe scatter plot shows the time spent texting, x, and the time spent exercising, ), by each of 24 students last week. (a) Write an approximate equation of the line of best fit for the data. It doesn't have to be the exact line of best fit. (b) Using your equation from part (a), predict the time spent exercising for a student who spends 5 hours texting. Note that you can use the graphing tools to help you approximate the line. (a) Write an approximate equation of the line of best fit. X 5 ? Time spent 1 = [ exercising (in hours) (b) Using your equation from part (a), predict the time spent exercising for a student who spends 5 hours texting. hours 2 Li X 5 ? Time spent texting (in hours)Three distributions, labeled (a), (b), and (c) are represented below by their histograms. Each distribution is symmetrical and is made of 10 measurements Without performing any calculations, order their respective standard deviations G. Up and a (a) (b) 45 6 7 8 9 10 11 12 13 14 9 10 11 12 13 14 (C) X A community may be considered sociologically healthier the more variability there is in its housing values (up to a point). A major newspaper in one city investigated housing costs in several communities in its area and is running a story on its findings. For one of the communities, a random sample of 50 houses was examined, and the current market price of each house was determined. The newspaper published the following histogram summarizing these 50 prices: Frequency IS 10- 80 120 160 200 240 280 Current market price (in thousands of dollars) Based on this histogram, estimate the standard deviation of the sample of 50 prices. Carry your intermediate computations to at least four decimal places, and round your answer to at least one decimal place. (If necessary, consult a list of formulas.)
Step by Step Solution
There are 3 Steps involved in it
Step: 1
Get Instant Access to Expert-Tailored Solutions
See step-by-step solutions with expert insights and AI powered tools for academic success
Step: 2
Step: 3
Ace Your Homework with AI
Get the answers you need in no time with our AI-driven, step-by-step assistance