

Question
Here is my code: As you can see, the output for the second graph is being weird and I don't think that the third is
Here is my code:
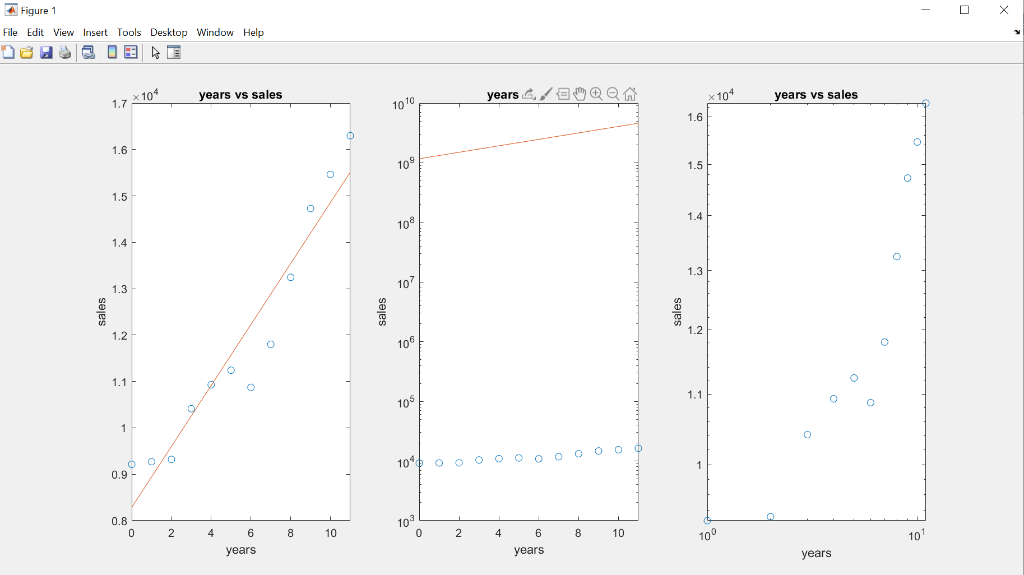
As you can see, the output for the second graph is being weird and I don't think that the third is working at all.
I think it's a simple fix, but I am not sure what to do.
%This program will plot some values and estimate the sales volume in 2018 clear all clc %Variables: x = 2004:2015; y = [9214, 9271, 9320, 10413, 10930, 11242, 10873, 11801, 13245, 14728, 15463, 16297]; x_new = x-2004; %Inputs: %The program will not ask the user for any inputs %Calculations: %No calculations needed %Output: subplot(1,3,1) p1 = polyfit(x_new,y,1); m1 = p1(1); b1 = p1(2); plot(x_new, y, 'o', x_new, m1.*x_new+b1), xlabel('years'), ylabel('sales'), title('years vs sales') subplot(1,3,2) p2 = polyfit(x_new,log(y),1); m2 = p2(1); b2 = 10^(p2(2)); semilogy(x_new, y, 'o', x_new, b2*10.^(m2.*x_new)), xlabel('years'), ylabel('sales'), title('years vs sales') subplot(1,3,3) p3 = polyfit(log10(x_new),log10(y),1); m3 = p3(1); b3 = 10^(p3(2)); loglog(x_new, y, 'o', x_new, b3.*x_new.^m3), xlabel('years'), ylabel('sales'), title('years vs sales')
And this is my output:
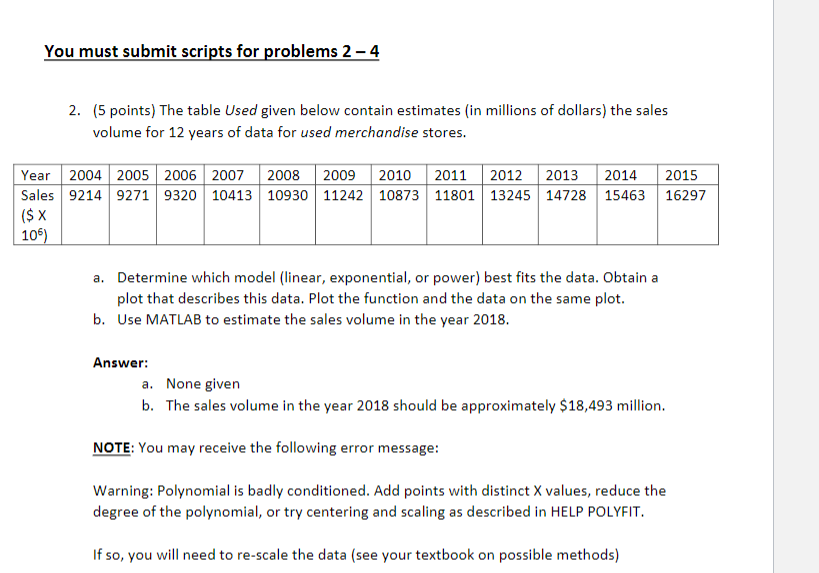
You must submit scripts for problems 2-4 2. (5 points) The table Used given below contain estimates (in millions of dollars) the sales volume for 12 years of data for used merchandise stores. 2014 15463 2015 16297 Year 2004 2005 2006 2007 2008 2009 2010 2011 2012 2013 Sales 9214 9271 9320 10413 10930 11242 10873 11801 13245 14728 ($ x 105) a. Determine which model (linear, exponential, or power) best fits the data. Obtain a plot that describes this data. Plot the function and the data on the same plot. b. Use MATLAB to estimate the sales volume in the year 2018. Answer: a. None given b. The sales volume in the year 2018 should be approximately $18,493 million. NOTE: You may receive the following error message: Warning: Polynomial is badly conditioned. Add points with distinct X values, reduce the degree of the polynomial, or try centering and scaling as described in HELP POLYFIT. If so, you will need to re-scale the data (see your textbook on possible methods) - DX Figure 1 File Edit View Insert Tools Desktop Window Help x 104 years vs sales years , ama * 104 years vs sales 1.7*104 1010 sales sales sales 10% 10 OOOOOOOOOO 10 0 2 4 8 10 0 2 4 8 10 6 years 6 years years
Step by Step Solution
There are 3 Steps involved in it
Step: 1

Get Instant Access to Expert-Tailored Solutions
See step-by-step solutions with expert insights and AI powered tools for academic success
Step: 2

Step: 3
Ace Your Homework with AI
Get the answers you need in no time with our AI-driven, step-by-step assistance
Get Started
Database Support For Data Mining Applications Discovering Knowledge With Inductive Queries Lnai 2682
Authors: Rosa Meo ,Pier L. Lanzi ,Mika Klemettinen
2004th Edition
3540224793, 978-3540224792