Answered step by step
Verified Expert Solution
Link Copied!

Question

1 Approved Answer

Here is my question follow the numerical order to solve it. #1 is the question # 2 is the dataset #3 is the options to

Here is my question follow the numerical order to solve it. #1 is the question # 2 is the dataset #3 is the options to choose from #4 is the options to choose from.
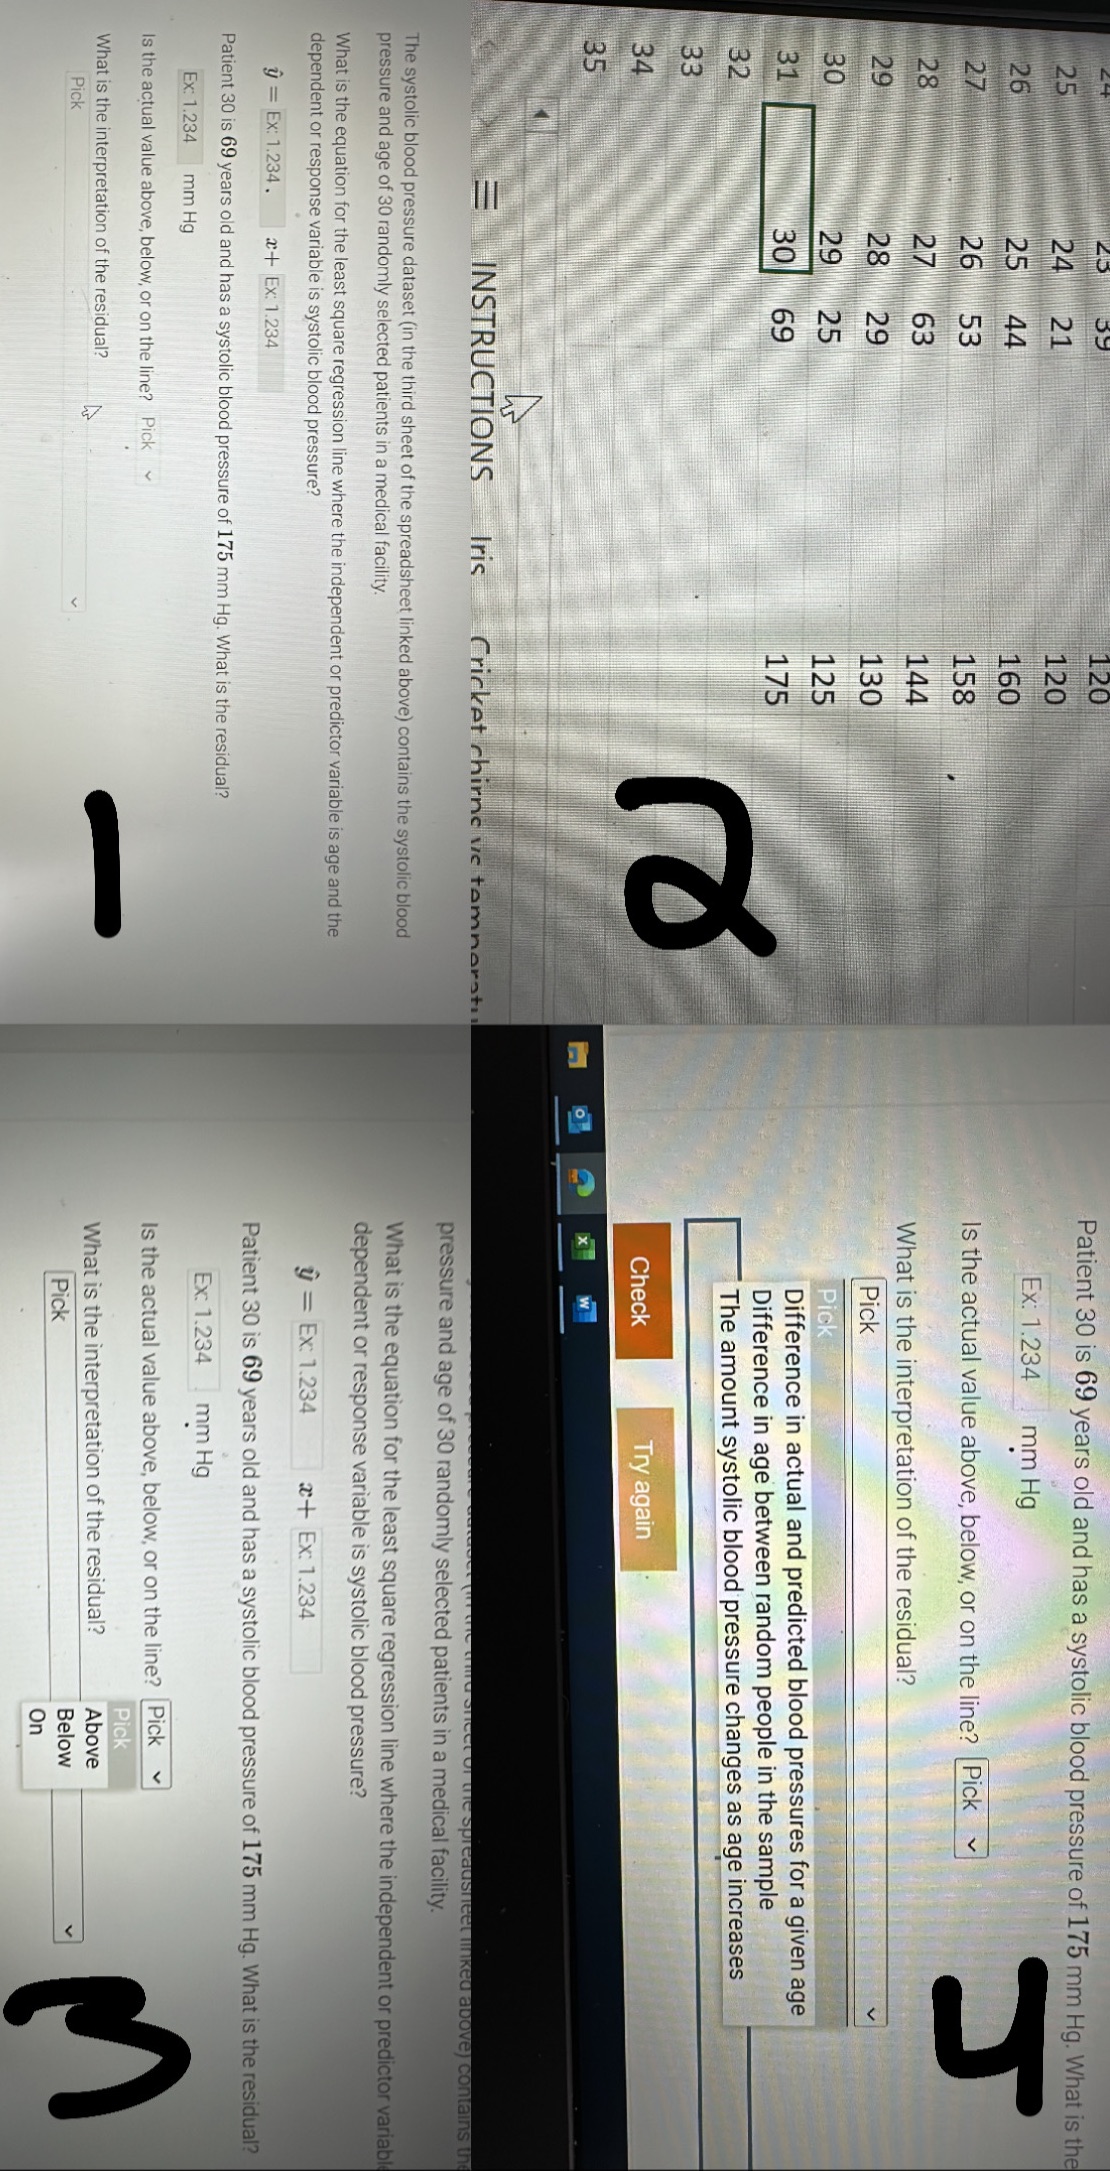
image text in transcribed
Patient 30 is 69 years old and has a systolic blood pressure of 175 mm Hg. What is the 120 Ex: 1.234 mm Hg 160 Is the actual value above, below, or on the line? Pick h 158 144 What is the interpretation of the residual? 130 Pick 125 Pick Difference in actual and predicted blood pressures for a given age 175 Difference in age between random people in the sample The amount systolic blood pressure changes as age increases e Check Try again X W INSTRUCTIONS Iris Cricket chirneve tomnoratin Spreadsheet linked above) contains u pressure and age of 30 randomly selected patients in a medical facility. The systolic blood pressure dataset (in the third sheet of the spreadsheet linked above) contains the systolic blood pressure and age of 30 randomly selected patients in a medical facility. What is the equation for the least square regression line where the independent or predictor variable dependent or response variable is systolic blood pressure? What is the equation for the least square regression line where the independent or predictor variable is age and the dependent or response variable is systolic blood pressure? y = Ex: 1.234 x+ Ex: 1.234 y = Ex: 1.234. 2+ Ex: 1.234 Patient 30 is 69 years old and has a systolic blood pressure of 175 mm Hg. What is the residual? Patient 30 is 69 years old and has a systolic blood pressure of 175 mm Hg. What is the residual? Ex: 1.234 mm Hg Ex: 1.234 mm Hg Is the actual value above, below, or on the line? Pick Is the actual value above, below, or on the line? Pick Pick What is the interpretation of the residual? 4 What is the interpretation of the residual? Above Pick Pick Below on

Step by Step Solution

There are 3 Steps involved in it

Step: 1

blur-text-image

Get Instant Access to Expert-Tailored Solutions

See step-by-step solutions with expert insights and AI powered tools for academic success

Step: 2

blur-text-image

Step: 3

blur-text-image

Ace Your Homework with AI

Get the answers you need in no time with our AI-driven, step-by-step assistance

Get Started

Recommended Textbook for

Intro Stats

Authors: Richard D. De Veaux, Paul F. Velleman, David E. Bock

3rd edition

321533283, 321533289, 9780321463708, 9780321503848, 9780321503800, 9780321499431, 9780321499417, 978-0321500458

More Books

Students also viewed these Mathematics questions