

Answered step by step
Verified Expert Solution
Question
1 Approved Answer
Here is the Balance Sheet: Here is the Income Statement: Here is the Statement of Cash Flows: Please answer these following questions: Consolidated Balance Sheets
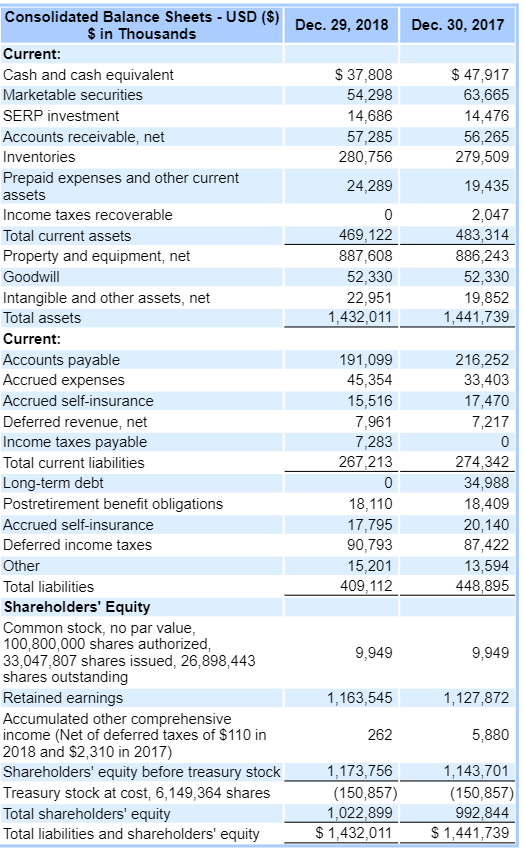
Here is the Balance Sheet:
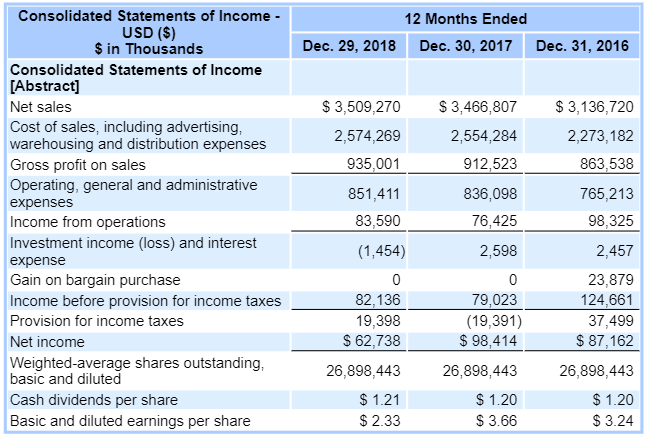
Here is the Income Statement:
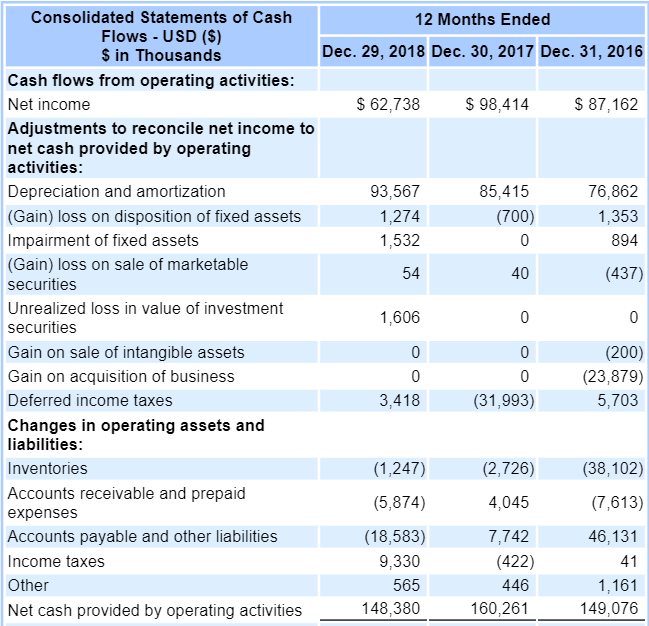
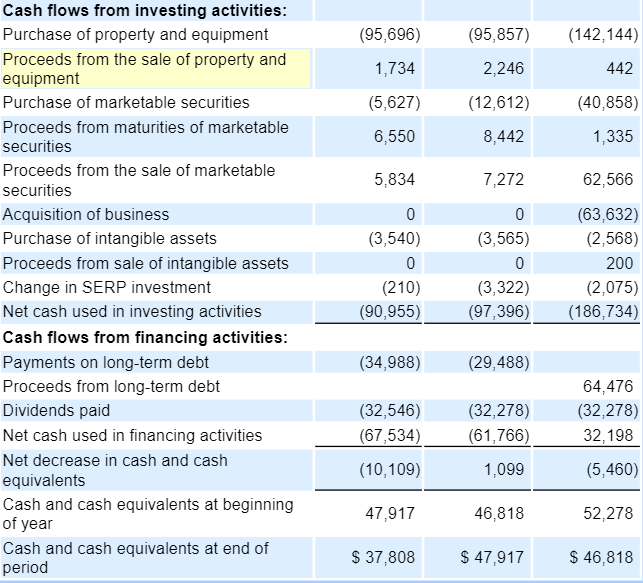
Here is the Statement of Cash Flows:
Please answer these following questions:
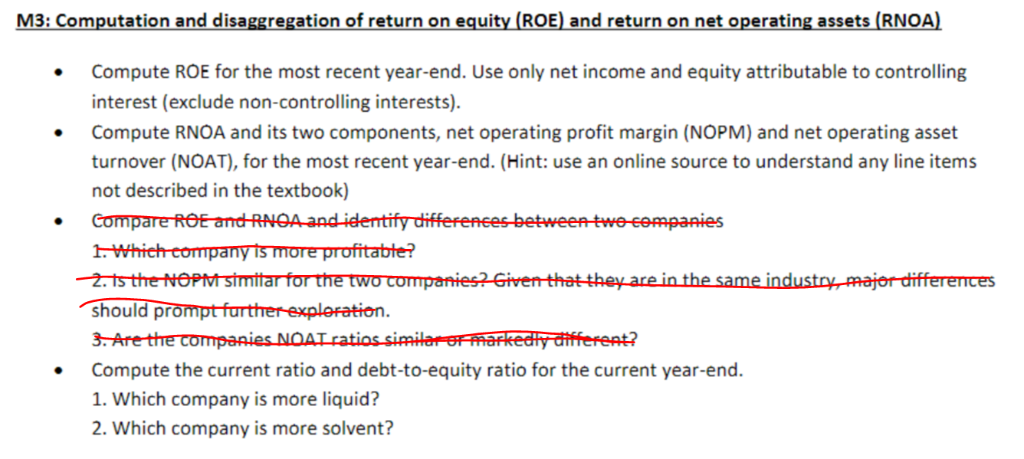
Consolidated Balance Sheets - USD (S) Dec. 29, 2018 Dec. 30, 2017 $ in Thousands Current: Cash and cash equivalent Marketable securities SERP investment Accounts receivable, net Inventories S 37,808 54,298 14,686 57,285 280,756 $ 47,917 63,665 14,476 56,265 279,509 19,435 Prepaid expenses and other current assets Income taxes recoverable Total current assets Property and equipment, net Goodwill Intangible and other assets, net Total assets Current: 24,289 2,047 483,314 886,243 52,330 19,852 1,441,739 469,122 887,608 52,330 22,951 1,432,011 191,099 45,354 15,516 Accounts payable Accrued expenses Accrued self-insurance Deferred revenue, net Income taxes payable Total current liabilities Long-term debt Postretirement benefit obligations Accrued self-insurance Deferred income taxes 216,252 33,403 17,470 7,283 267,213 274,342 34,988 18,409 20,140 87,422 13,594 448,895 17,795 90,793 15,201 409,112 Total liabilities Shareholders' Equity Common stock, no par value 100,800,000 shares authorized 33,047,807 shares issued, 26,898,443 shares outstanding 9,949 9,949 1,127,872 5,880 1,163,545 Retained earnings Accumulated other comprehensive income (Net of deferred taxes of $110 in 2018 and $2,310 in 2017) Shareholders' equity before treasury stock Treasury stock at cost, 6,149,364 shares Total shareholders' equity Total liabilities and shareholders' equity 1,143,701 (150,857) 992,844 S 1,441,739 1.173.756 (150,857) 1.022.899 $ 1,432,011 Consolidated Statements of Income - USD ($) $ in Thousands 12 Months Ended Dec. 29, 2018 Dec. 30, 2017 Dec. 31, 2016 Consolidated Statements of Income [Abstract] Net sales Cost of sales, including advertising warehousing and distribution expenses Gross profit on sales Operating, general and administrative expenses Income from operations Investment income (loss) and interest expense Gain on bargain purchase Income before provision for income taxes Provision for income taxes Net income Weighted-average shares outstanding basic and diluted Cash dividends per share Basic and diluted earnings per share S 3,509,270 S3,466,807S 3,136,720 2,273,182 2,574,269 935,001 851,411 83,590 (1,454) 2,554,284 912,523 836,098 76,425 2,598 863,538 765,213 98.325 2,457 23,879 124.661 37,499 $ 87,162 79,023 (19,391) $ 98,414 26,898,44:3 $1.20 $ 3.66 82,136 19,398 $ 62,738 26,898,44:3 $1.20 $ 3.24 26,898,443 $1.21 $ 2.33 Consolidated Statements of Cash Flows - USD (S) $ in Thousands 12 Months Ended Dec. 29, 2018 Dec. 30, 2017 Dec. 31, 2016 Cash flows from operating activities Net income $ 98,414 $ 62,738 $ 87,162 Adjustments to reconcile net income to net cash provided by operating activities 76,862 1,353 894 93,567 1,274 1,532 54 85,415 (700) Depreciation and amortization (Gain) loss on disposition of fixed assets Impairment of fixed assets (Gain) loss on sale of marketable securitiess Unrealized loss in value of investment securities 40 (437) 1,606 (200) (23,879) 5,703 Gain on sale of intangible assets Gain on acquisition of business Deferred income taxes (31,993) 3,418 Changes in operating assets and liabilities (1,247) (5,874) (18,583) 9,330 565 148,380 (38,102) (7,613) 46,131 Inventories (2,726) 4,045 7,742 Accounts receivable and prepaid expenses Accounts payable and other liabilities Income taxes Other (422) 446 160,261 1,161 149.076 Net cash provided by operating activities Cash flows from investing activities Purchase of property and equipment Proceeds from the sale of property and equipment Purchase of marketable securities Proceeds from maturities of marketable securities Proceeds from the sale of marketable securities Acquisition of business Purchase of intangible assets Proceeds from sale of intangible assets Change in SERP investment Net cash used in investing activities Cash flows from financing activities Payments on long-term debt Proceeds from long-term debt Dividends paid Net cash used in financing activities Net decrease in cash and cash equivalents Cash and cash equivalents at beginning of year Cash and cash equivalents at end of period (95,696) 1,734 (5,627) 6,550 5,834 (95,857) (142,144) 2,246 (12,612) 8,442 7,272 442 (40,858) 1,335 62,566 (63,632) (2,568) 200 (2,075) (97,396) (186,734) (3,565) (3,540) (210) (90,955) (3,322) (34,988) (29,488) 64,476 (32,278) 32,198 (32,546) (67,534) (10,109) 47.917 S 37,808 (32,278) (61,766) 1,099 46,818 S 47,917 (5,460) 52,278 $ 46,818 M3: Computation and disaggregation of return on equity (ROE) and return on net operating assets (RNOA) Compute ROE for the most recent year-end. Use only net income and equity attributable to controlling interest (exclude non-controlling interests). Compute RNOA and its two components, net operating profit margin (NOPM) and net operating asset turnover (NOAT), for the most recent year-end. (Hint: use an online source to understand any line items not described in the textbook) Compare ROE and 1whichcompany is more prontable 2.ts the NOPMsimitar for the two companies? Given that they are in the same industry major differences should pr n. Are the companies NOAT ratios similar emarkedfyferent? Compute the current ratio and debt-to-equity ratio for the current year-end. 1. Which company is more liquid? 2. Which company is more solvent? Consolidated Balance Sheets - USD (S) Dec. 29, 2018 Dec. 30, 2017 $ in Thousands Current: Cash and cash equivalent Marketable securities SERP investment Accounts receivable, net Inventories S 37,808 54,298 14,686 57,285 280,756 $ 47,917 63,665 14,476 56,265 279,509 19,435 Prepaid expenses and other current assets Income taxes recoverable Total current assets Property and equipment, net Goodwill Intangible and other assets, net Total assets Current: 24,289 2,047 483,314 886,243 52,330 19,852 1,441,739 469,122 887,608 52,330 22,951 1,432,011 191,099 45,354 15,516 Accounts payable Accrued expenses Accrued self-insurance Deferred revenue, net Income taxes payable Total current liabilities Long-term debt Postretirement benefit obligations Accrued self-insurance Deferred income taxes 216,252 33,403 17,470 7,283 267,213 274,342 34,988 18,409 20,140 87,422 13,594 448,895 17,795 90,793 15,201 409,112 Total liabilities Shareholders' Equity Common stock, no par value 100,800,000 shares authorized 33,047,807 shares issued, 26,898,443 shares outstanding 9,949 9,949 1,127,872 5,880 1,163,545 Retained earnings Accumulated other comprehensive income (Net of deferred taxes of $110 in 2018 and $2,310 in 2017) Shareholders' equity before treasury stock Treasury stock at cost, 6,149,364 shares Total shareholders' equity Total liabilities and shareholders' equity 1,143,701 (150,857) 992,844 S 1,441,739 1.173.756 (150,857) 1.022.899 $ 1,432,011 Consolidated Statements of Income - USD ($) $ in Thousands 12 Months Ended Dec. 29, 2018 Dec. 30, 2017 Dec. 31, 2016 Consolidated Statements of Income [Abstract] Net sales Cost of sales, including advertising warehousing and distribution expenses Gross profit on sales Operating, general and administrative expenses Income from operations Investment income (loss) and interest expense Gain on bargain purchase Income before provision for income taxes Provision for income taxes Net income Weighted-average shares outstanding basic and diluted Cash dividends per share Basic and diluted earnings per share S 3,509,270 S3,466,807S 3,136,720 2,273,182 2,574,269 935,001 851,411 83,590 (1,454) 2,554,284 912,523 836,098 76,425 2,598 863,538 765,213 98.325 2,457 23,879 124.661 37,499 $ 87,162 79,023 (19,391) $ 98,414 26,898,44:3 $1.20 $ 3.66 82,136 19,398 $ 62,738 26,898,44:3 $1.20 $ 3.24 26,898,443 $1.21 $ 2.33 Consolidated Statements of Cash Flows - USD (S) $ in Thousands 12 Months Ended Dec. 29, 2018 Dec. 30, 2017 Dec. 31, 2016 Cash flows from operating activities Net income $ 98,414 $ 62,738 $ 87,162 Adjustments to reconcile net income to net cash provided by operating activities 76,862 1,353 894 93,567 1,274 1,532 54 85,415 (700) Depreciation and amortization (Gain) loss on disposition of fixed assets Impairment of fixed assets (Gain) loss on sale of marketable securitiess Unrealized loss in value of investment securities 40 (437) 1,606 (200) (23,879) 5,703 Gain on sale of intangible assets Gain on acquisition of business Deferred income taxes (31,993) 3,418 Changes in operating assets and liabilities (1,247) (5,874) (18,583) 9,330 565 148,380 (38,102) (7,613) 46,131 Inventories (2,726) 4,045 7,742 Accounts receivable and prepaid expenses Accounts payable and other liabilities Income taxes Other (422) 446 160,261 1,161 149.076 Net cash provided by operating activities Cash flows from investing activities Purchase of property and equipment Proceeds from the sale of property and equipment Purchase of marketable securities Proceeds from maturities of marketable securities Proceeds from the sale of marketable securities Acquisition of business Purchase of intangible assets Proceeds from sale of intangible assets Change in SERP investment Net cash used in investing activities Cash flows from financing activities Payments on long-term debt Proceeds from long-term debt Dividends paid Net cash used in financing activities Net decrease in cash and cash equivalents Cash and cash equivalents at beginning of year Cash and cash equivalents at end of period (95,696) 1,734 (5,627) 6,550 5,834 (95,857) (142,144) 2,246 (12,612) 8,442 7,272 442 (40,858) 1,335 62,566 (63,632) (2,568) 200 (2,075) (97,396) (186,734) (3,565) (3,540) (210) (90,955) (3,322) (34,988) (29,488) 64,476 (32,278) 32,198 (32,546) (67,534) (10,109) 47.917 S 37,808 (32,278) (61,766) 1,099 46,818 S 47,917 (5,460) 52,278 $ 46,818 M3: Computation and disaggregation of return on equity (ROE) and return on net operating assets (RNOA) Compute ROE for the most recent year-end. Use only net income and equity attributable to controlling interest (exclude non-controlling interests). Compute RNOA and its two components, net operating profit margin (NOPM) and net operating asset turnover (NOAT), for the most recent year-end. (Hint: use an online source to understand any line items not described in the textbook) Compare ROE and 1whichcompany is more prontable 2.ts the NOPMsimitar for the two companies? Given that they are in the same industry major differences should pr n. Are the companies NOAT ratios similar emarkedfyferent? Compute the current ratio and debt-to-equity ratio for the current year-end. 1. Which company is more liquid? 2. Which company is more solvent
Step by Step Solution
There are 3 Steps involved in it
Step: 1

Get Instant Access to Expert-Tailored Solutions
See step-by-step solutions with expert insights and AI powered tools for academic success
Step: 2

Step: 3
Ace Your Homework with AI
Get the answers you need in no time with our AI-driven, step-by-step assistance
Get Started
Accounting Comes Alive The Color Accounting Parable
Authors: Mark Robilliard ,Peter Frampton, Chang Chang, Mark Morrow, John Gorman
1st Edition
1450769608, 978-1450769600