Here is the graph along with the questions I answered. I just want to make sure that they are right. I also sent another attachment with the graph zoomed in. Thanks in advance.
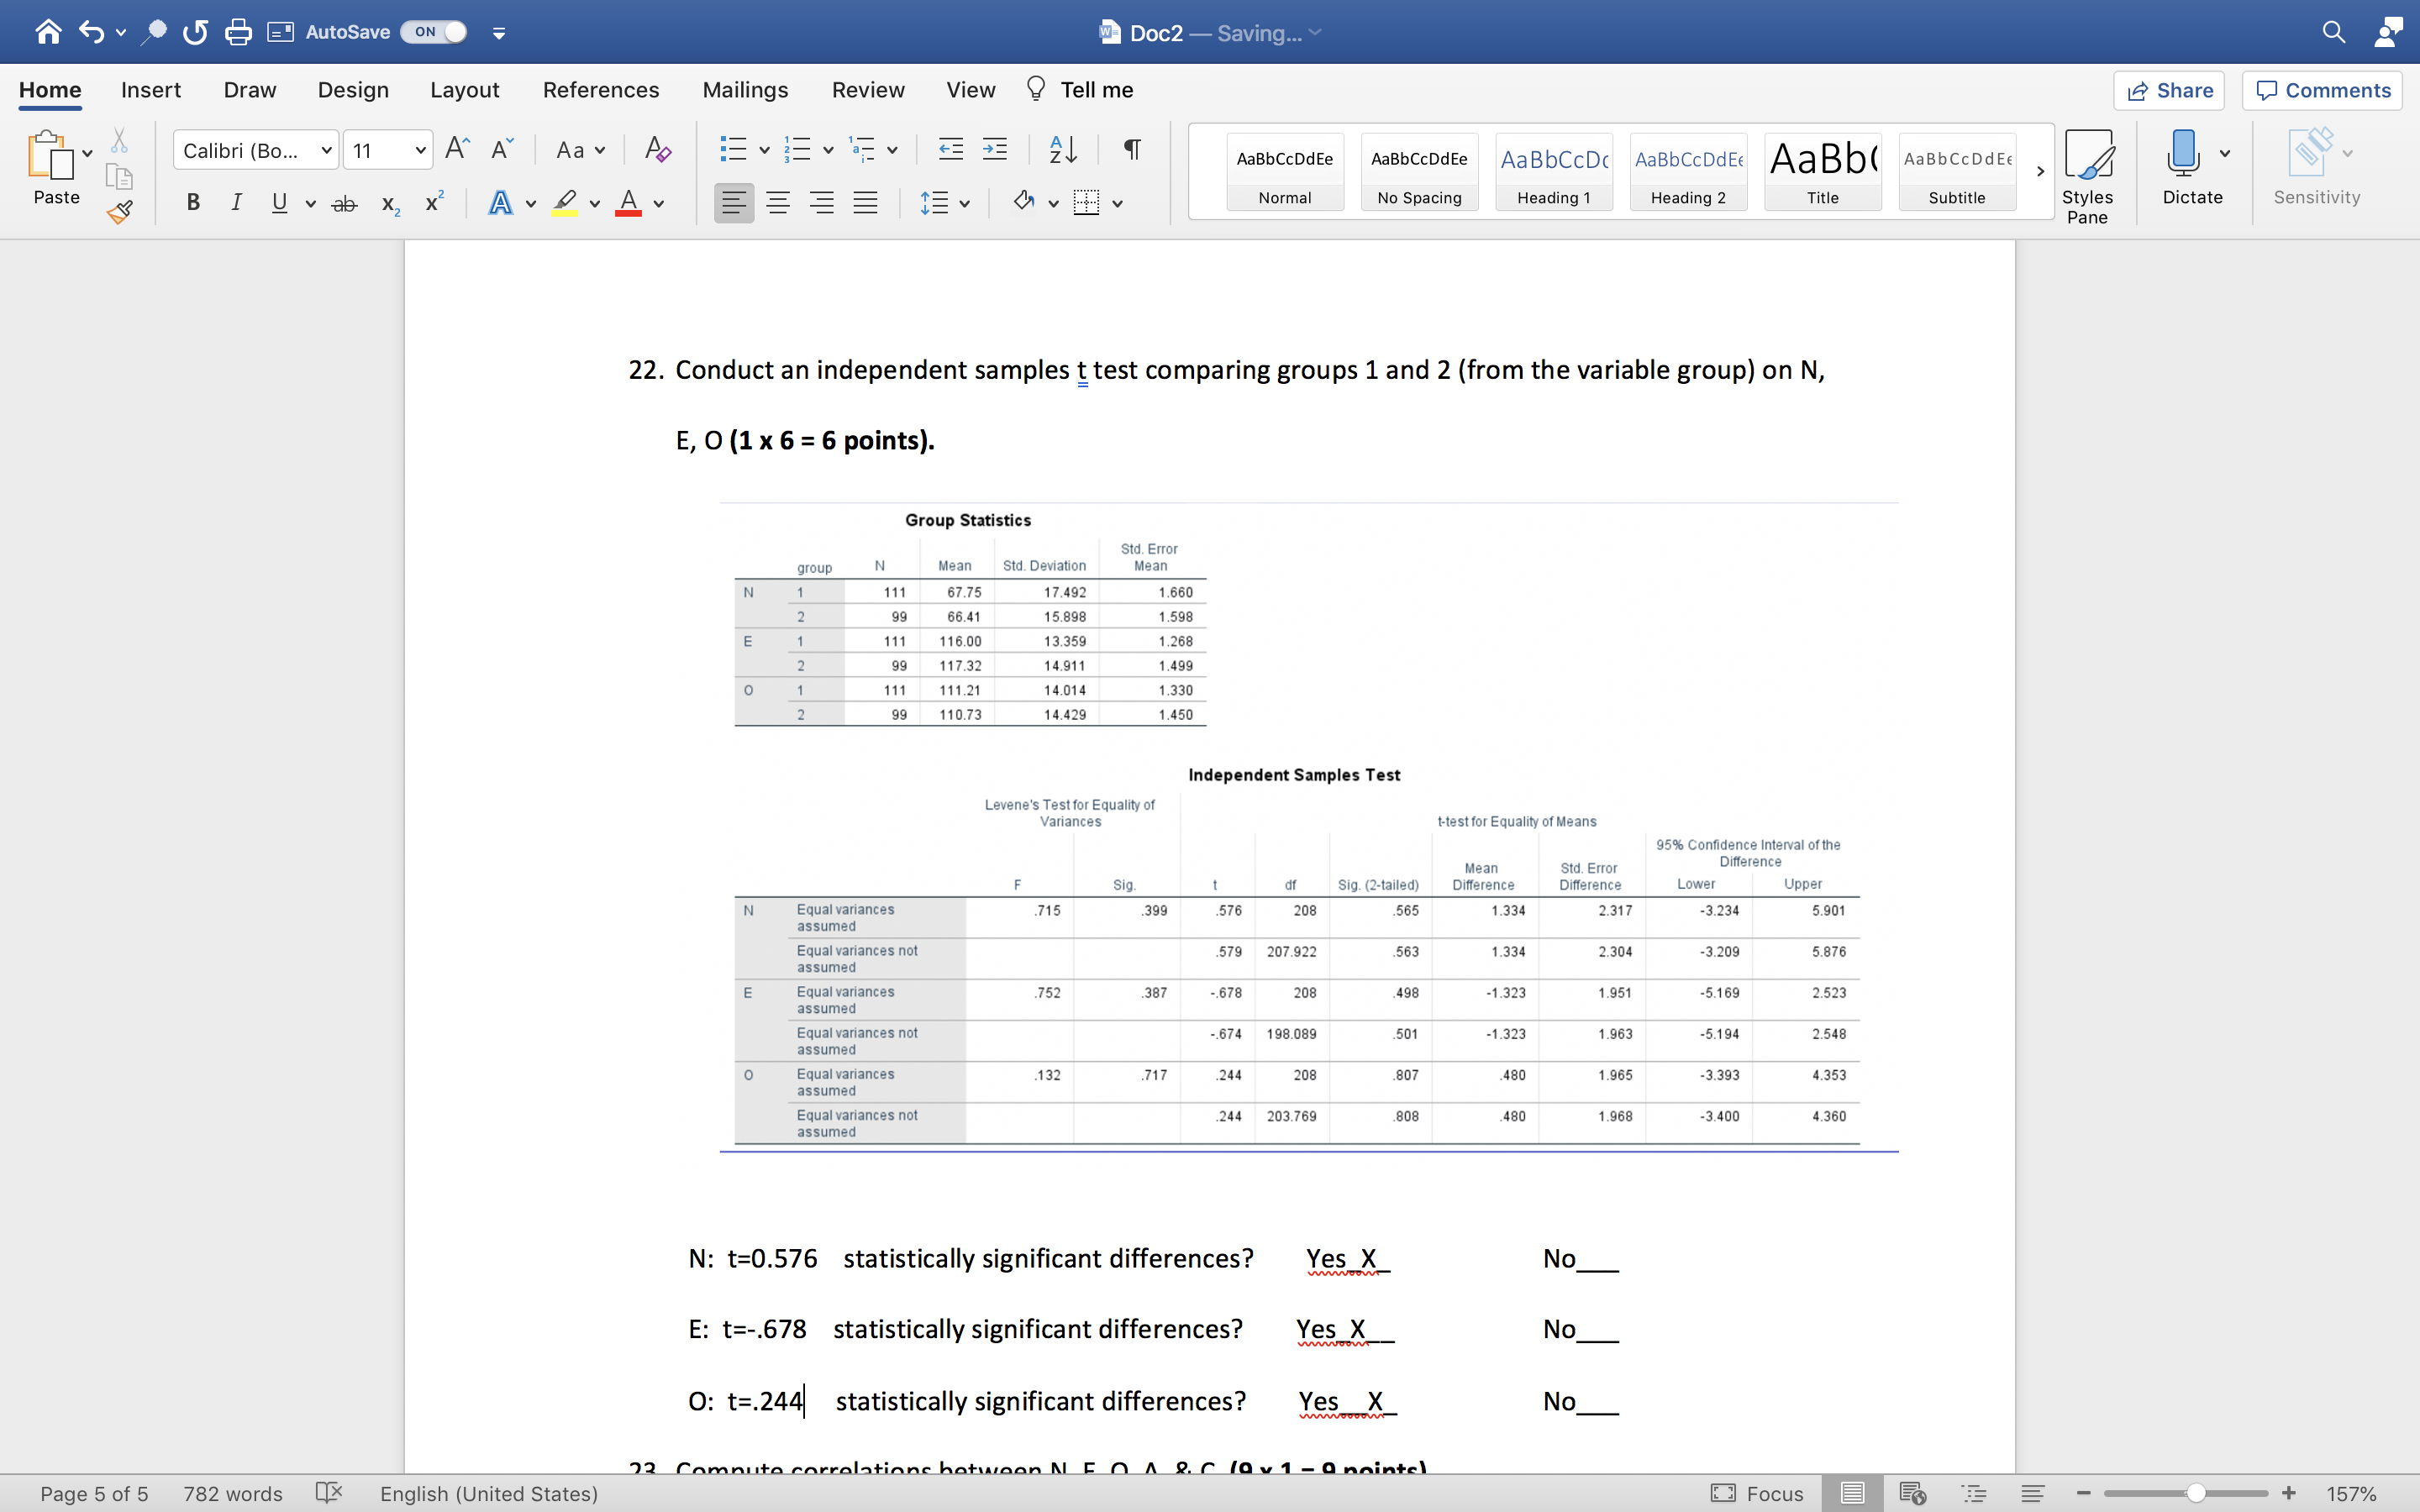
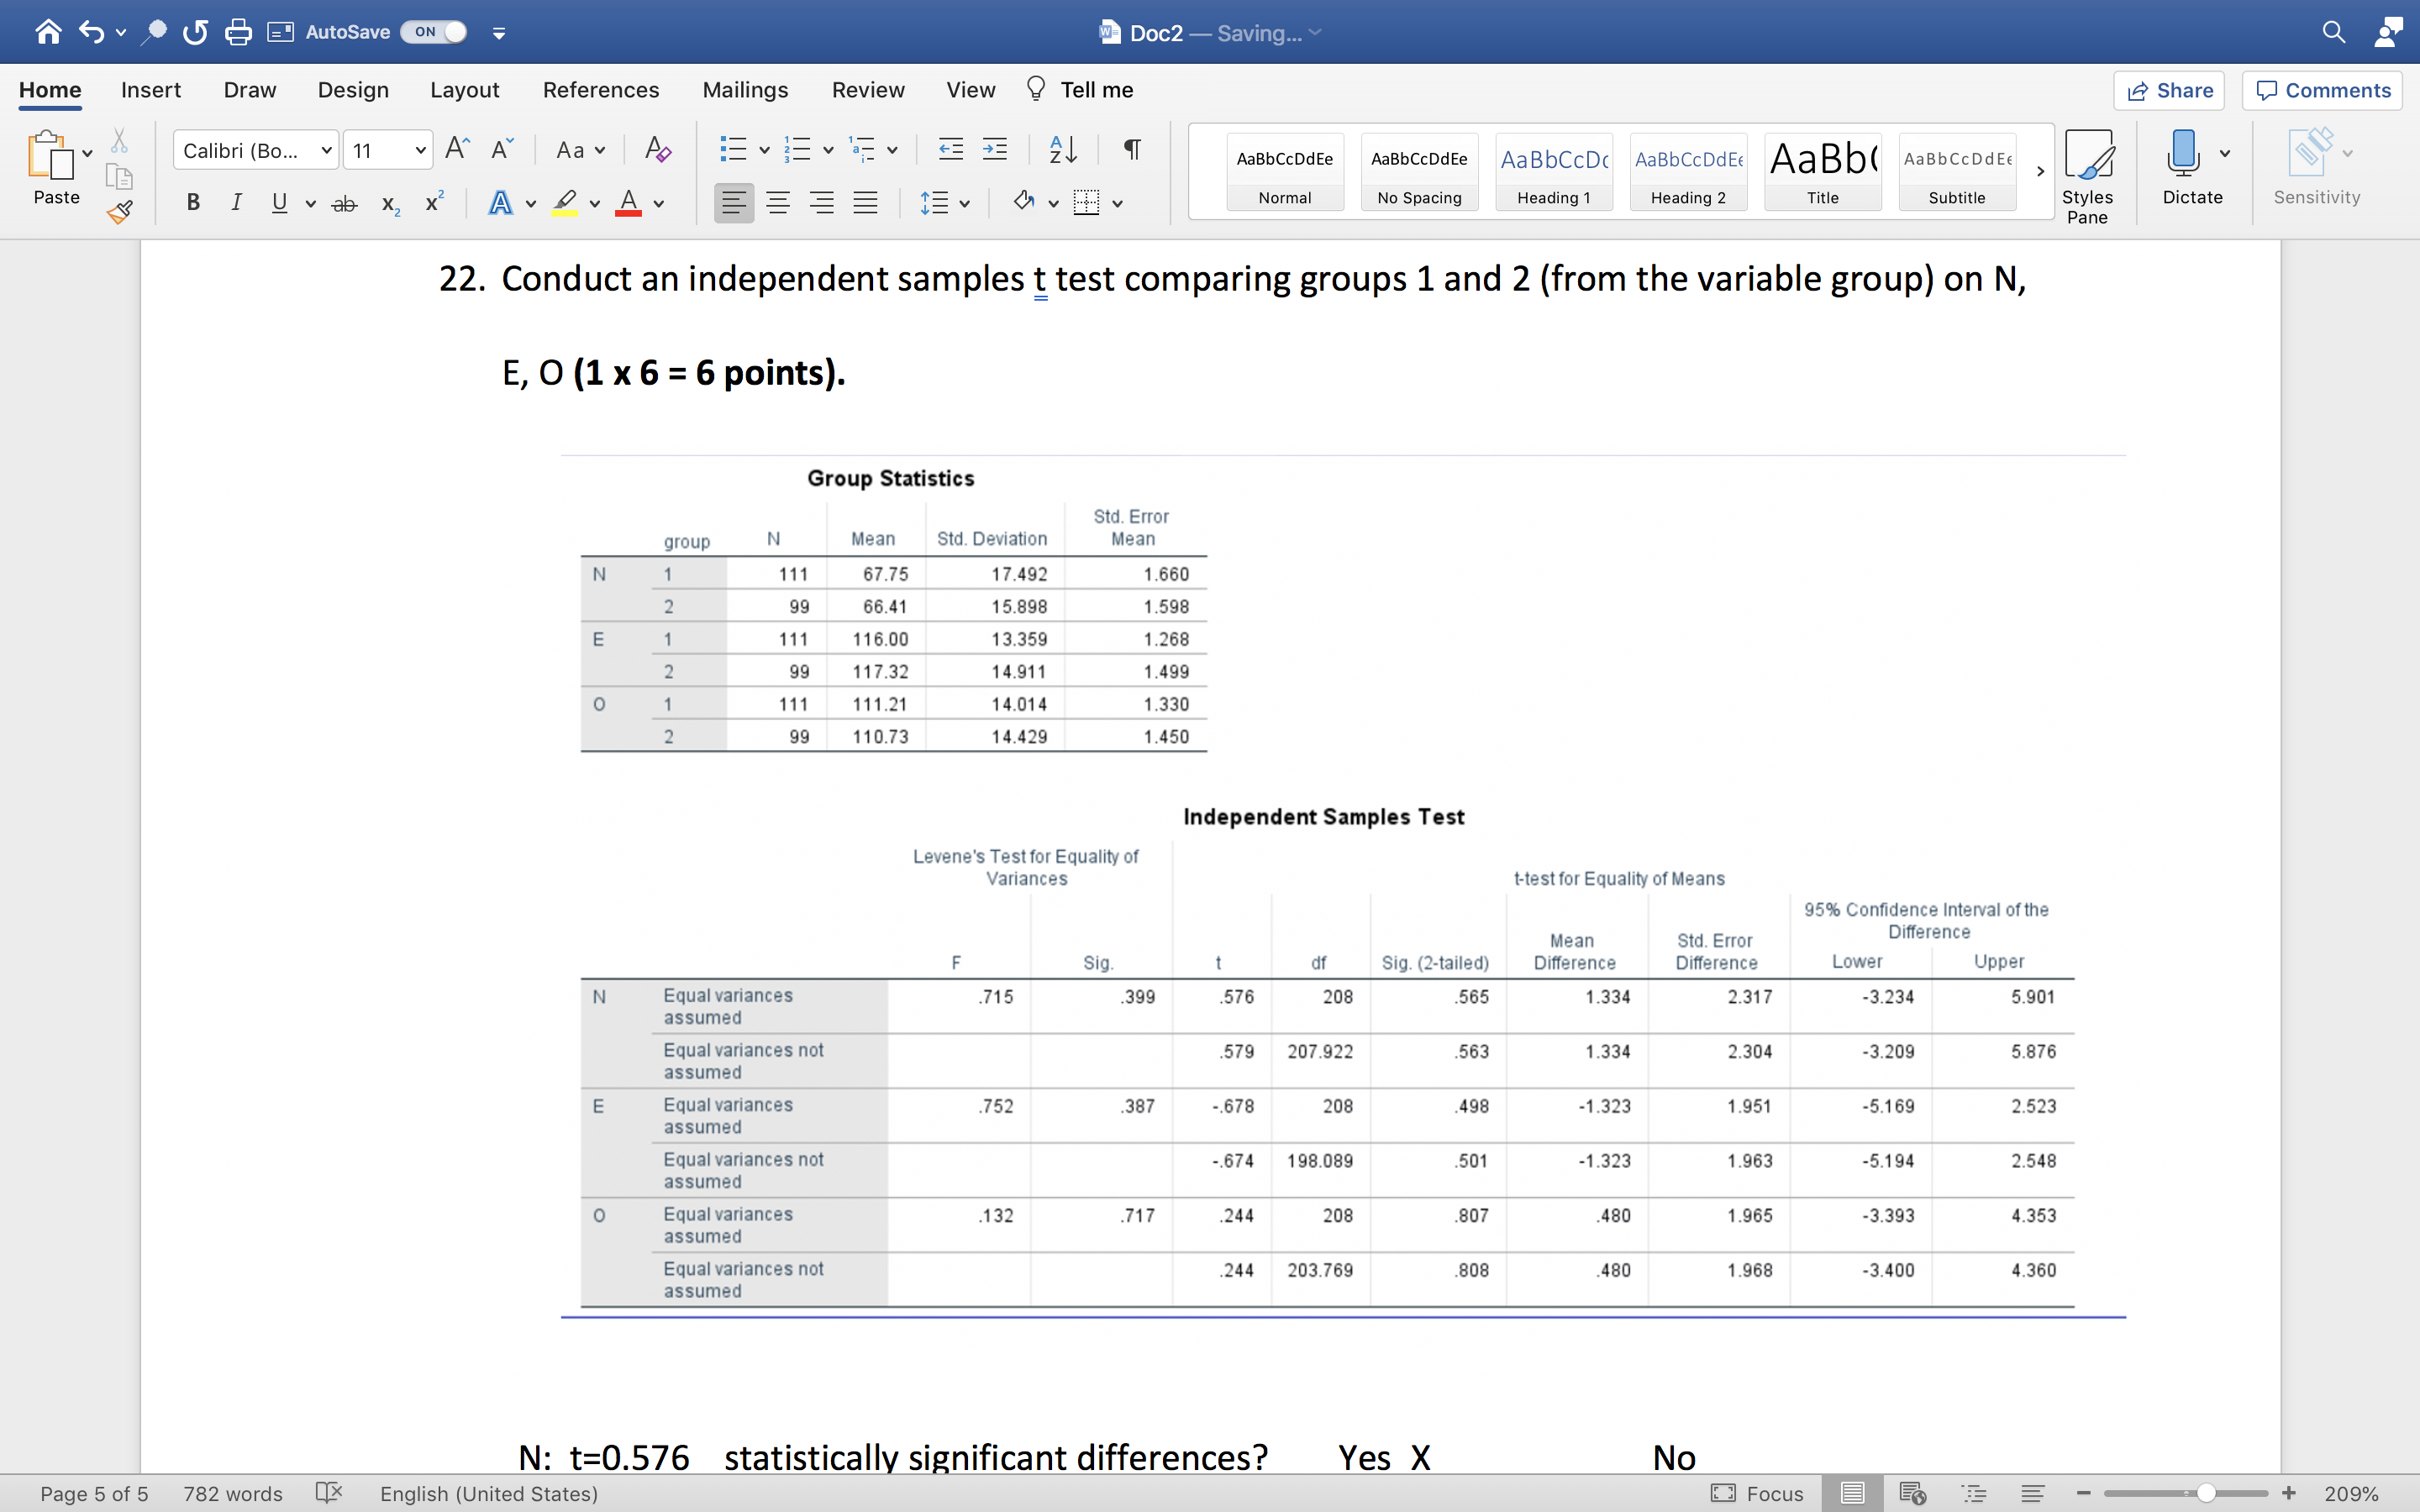
AutoSave ON Doc2 - Saving... Home Insert Draw Design Layout References Mailings Review View Tell me Share Comments Calibri (Bo... v 11 A A Aa Ap 24 T AaBbCcDdEe AaBbCcDdEe AaBbCcDc AaBbCcDdE AaBb( AaBbCCDdEF Norma Heading 1 Title Subtitle Styles Sensitivity Paste BI Uvab x x A DAY No Spacing Heading 2 Dictate Pane 22. Conduct an independent samples t test comparing groups 1 and 2 (from the variable group) on N, E, O (1 x 6 = 6 points). Group Statistics Std. Error group Mean Std. Deviation Mean N 111 67.75 17.492 1.660 99 66.41 15.898 1.598 E 11 116.00 13.359 1.268 99 117.32 14.911 1.499 o 111 111.21 14.014 1.330 99 110.73 14.429 1.450 Independent Samples Test Levene's Test for Equality of Variances t-test for Equality of Means 95% Confidence Interval of the Mean Std. Error Difference Sig. df Sig. (2-tailed) Difference Difference Lower Upper Equal variances .715 .399 576 208 .56 1.334 2.317 -3.234 5.901 N assumed Equal variances not 579 207.922 563 1.334 2.304 -3.209 5.876 assumed E Equal variances 752 387 - 678 208 498 -1.323 1.951 -5.169 2.523 assumed Equal variances not .674 198.089 501 1.323 1.963 5.194 2.548 assumed O Equal variances .132 717 244 208 807 480 1.965 -3.393 4.353 assumed Equal variances not .244 203.769 808 480 1.968 -3.400 4.360 assumed N: t=0.576 statistically significant differences? Yes X No_ E: t=-.678 statistically significant differences? Yes X No O: t=.244 statistically significant differences? Yes X No 22 Comnite corralations hotwoon N E Q A Q.C /Q v 1 - 0 nnintel 782 words E 157% Page 5 of 5 English (United States) Focus +AutoSave ON w Doc2 - Saving... Home Insert Draw Design Layout References Mailings Review View Tell me Share Comments Calibri (Bo... v 11 A" A Aa Ap EV EVEVEE AaBbCcDdEe AaBbCcDdEe AaBbCcDc AaBbCcDdE AaBb( AaBbCCDdEE Paste BIUvab X X A DAY Norma No Spacing Heading 1 Heading 2 Title Subtitle Styles Dictate Sensitivity Pane 22. Conduct an independent samples t test comparing groups 1 and 2 (from the variable group) on N, E, O (1 x 6 = 6 points). Group Statistics Std. Error group N Mean Std. Deviation Mean N 111 67.75 17.492 1.660 2 99 66.41 15.898 1.598 E 111 116.00 13.359 1.268 2 99 117.32 14.911 1.499 C 1 111 111.21 14.014 1.330 2 99 110.73 14.429 1.450 Independent Samples Test Levene's Test for Equality of Variances t-test for Equality of Means 95% Confidence Interval of the Mean Std. Error Difference F Sig. df Sig. (2-tailed) Difference Difference Lower Upper N Equal variances 715 .399 576 BOZ 565 1.334 2.317 .3.234 5.901 assumed Equal variances not 579 207.922 563 1.334 2.304 -3.209 5.876 assumed E Equal variances 752 387 - 678 208 498 -1.323 1.951 -5.169 2.523 assumed Equal variances not .674 198.089 501 -1.323 1.963 -5.194 2.548 assumed O Equal variances 132 .717 .244 208 807 480 1.965 3.393 1.353 assumed Equal variances not 244 203.769 808 480 1.968 -3.400 4.360 assumed N: t=0.576 statistically significant differences? Yes X No Page 5 of 5 782 words English (United States) Focus + 209%