

Answered step by step
Verified Expert Solution
Question
1 Approved Answer
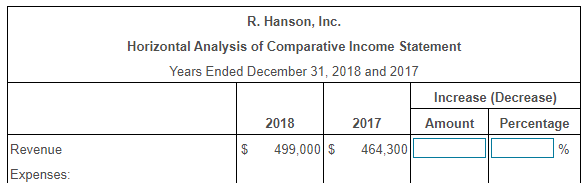
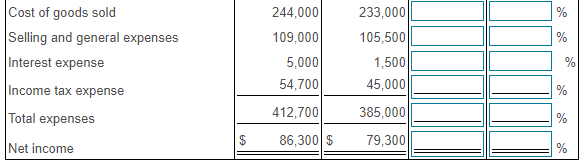
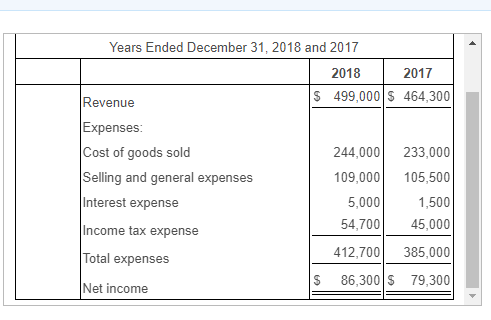
Here is the Income Statement. R. Hanson, Inc. Horizontal Analysis of Comparative Income Statement Years Ended December 31, 2018 and 2017 Increase (Decrease) 2018 2017
Here is the Income Statement.
Step by Step Solution
There are 3 Steps involved in it
Step: 1

Get Instant Access to Expert-Tailored Solutions
See step-by-step solutions with expert insights and AI powered tools for academic success
Step: 2

Step: 3
Ace Your Homework with AI
Get the answers you need in no time with our AI-driven, step-by-step assistance
Get Started
Audits Of Public Companies Continued Concentration In Audit Market For Large Public Companies Does Not Call For Immediate Action
Authors: United States Government Accountability
1st Edition
1297008111, 978-1297008115