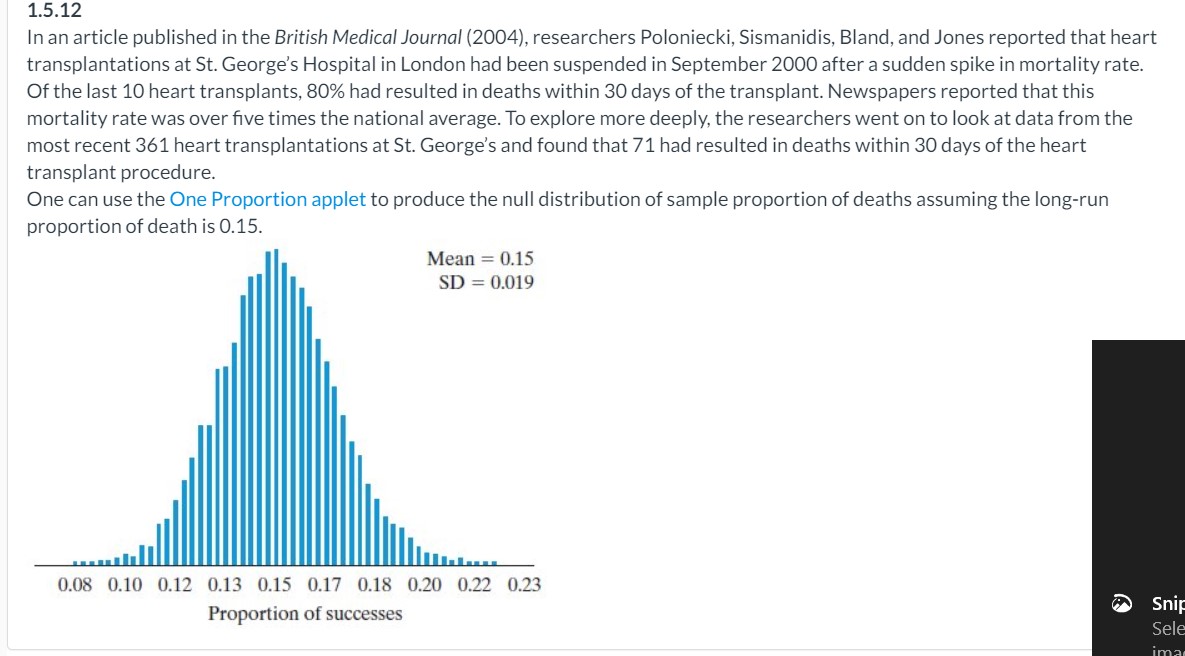
Here is the link for the applet: http://www.rossmanchance.com/ISIapplets.html
1.5.12 In an article published in the British Medical Journal (2004), researchers Poloniecki, Sismanidis, Bland, and Jones reported that heart transplantations at St. George's Hospital in London had been suspended in September 2000 after a sudden spike in mortality rate. Of the last 10 heart transplants, 80% had resulted in deaths within 30 days of the transplant. Newspapers reported that this mortality rate was over ve times the national average. To explore more deeply, the researchers went on to look at data from the most recent 361 heart transplantations at St. George's and found that 71 had resulted in deaths within 30 days of the heart transplant procedure. One can use the One Proportion applet to produce the null distribution of sample proportion of deaths assuming the long-run proportion of death is 0.15. Mean = 0.15 SD = 0.019 0.08 0.10 0.12 0.13 0.15 0.17 0.18 0.20 0.22 023 Proportion of successes According to the dot plot produced by the applet, what is the mean of the null distribution? Explain how you could have anticipated this. O 0.15; this is the hypothesized parameter value of 0.15 O none of these are the mean of the null distribution O 15; this is the hypothesized parameter value of 0.15 O 1.5; this is the hypothesized parameter value of 0.15 eTextbook and Media According to the dotplot produced by the applet, what is the SD of the null distribution? (Round your answer to 3 decimal places, e.g. 5.275) HIBelow is a null distribution that could be used in this context except for a sample size of 10 instead of 361. Explain why the normal approximation works better for the initial data set than one for a sample size of 10. 480 T Mean = 0.152 SD = 0.113 320 160 0 0 0.1 0.2 0.3 0.4 0.5 0.6 Proportion of successes O The data are insufficient to determine the cause. O Because the validity conditions are not met for this data set O Because the normal conditions are not met for this data set (smaller sample size) O Because the validity conditions are met for this data set (larger sample size)According to the dot plot produced by the applet, is the overall shape of the null distribution bell-shaped? That is, can the null distribution be described as being a normal distribution? O no O yes O there is insufficient information