Question
Here is the scenario that all groups will address when writing their group project report: Your company has run into a scandal similar in financial
Here is the scenario that all groups will address when writing their group project report:
Your company has run into a scandal similar in financial impact to the one faced by Volkswagen in 2015. Your company will have to create a provision equal in size to 10% of its most recent revenues. Assume that the impact will make it too expensive to raise cash from financing. That is, assume the company will be seen as riskier, making it unfeasible to raise the funds by issuing shares or borrowing. That means that the costs to deal with the scandal will have to be paid out of operating cash flows. Assume that this will take two fiscal years.
Your job is to prepare a report for the Board of Directors advising them on how well the company will be able to survive this financial event. You should NOT prepare pro forma statements to forecast the future. Just interpret the event in terms of the impacts the scandal will have on the companys (a) financial position, (b) financial performance, and (c) cash flows, as disclosed by the company in its most recent annual financial statements. Use an appropriate combination of financial ratios, trend analysis, common size analysis, and raw financial numbers to support your argument.
Some advice
It is quite possible that for some very healthy companies, such an event would clearly have little impact. Conversely, for some struggling companies, such an event would put the company out of business. Most companies will be somewhere in the middle, where the impact is ambiguous. Whatever your opinion is on the severity of the impact on your company, you must provide a well supported argument.
Remember to connect each of your insights to the basic question you have been asked to address. Avoid generic financial analysis observations that are unrelated to the point of the report. Remember to come to an overall conclusion. Finally, remember to play the role: address the board of directors and do not waste their time telling them things they already know, like the name of the company and what industry it is in.
Introduction
Explain clearly the purpose of the report and your recommendation. Do not save your recommendation for the conclusion of the report -- this is business writing, not a mystery novel.
Include any brief, relevant, contextual information that the reader should keep in mind that will help them understand your report. Consider your audience when you do this: you wouldn't tell a board member, for instance, what industry the company is in, but you might stress something about that industry that was important to keep in mind, such as a global shortage of a key commodity or the specific impact of the COVID pandemic on your industry.
Analysis
Your analysis must be organized into three subsections: financial position, financial performance, and cash flows. These three subsections should be given roughly equal emphasis, as they are weighted equally in the grading rubric.
Each of these subsections requires you to interpret one of the main financial statements (balance sheet, income statement and cash flow statement) in light of all the relevant financial and contextual information available to you. Focus your interpretation on the specific scenario you are addressing. Do not include information or calculations that are irrelevant to this scenario, even if you spent a lot of time on them when building your spreadsheet. A good analysis helps the reader focus on the most important information.
Back up your analysis with your spreadsheet calculations. Don't just state your calculations. Interpret them and link them to your argument. Your calculations are not your point. Your calculations support your point.
Do not rely extensively on other sources. This is a financial statement analysis assignment, not a strategy or marketing assignment. Do not draw on financial analysts you have found online. They are blissfully unaware of the scenario posited to you, and your grade depends on what you think, not on what they think.
Conclusion
Draw all the insights from your analysis together into a coherent argument. Connect the dots for the reader.
State your overall conclusion again, even though you stated it in the introduction. Don't leave the reader in any doubt about what you think.
Note any information and analytical insights that cause you concern (i.e., things that do not support your argument), or unresolved questions that arose in your analysis. It is not credible to pretend that every aspect of your analysis pointed unambiguously to the same conclusion, or that the annual reports contained every bit of information necessary to respond to the scenario.
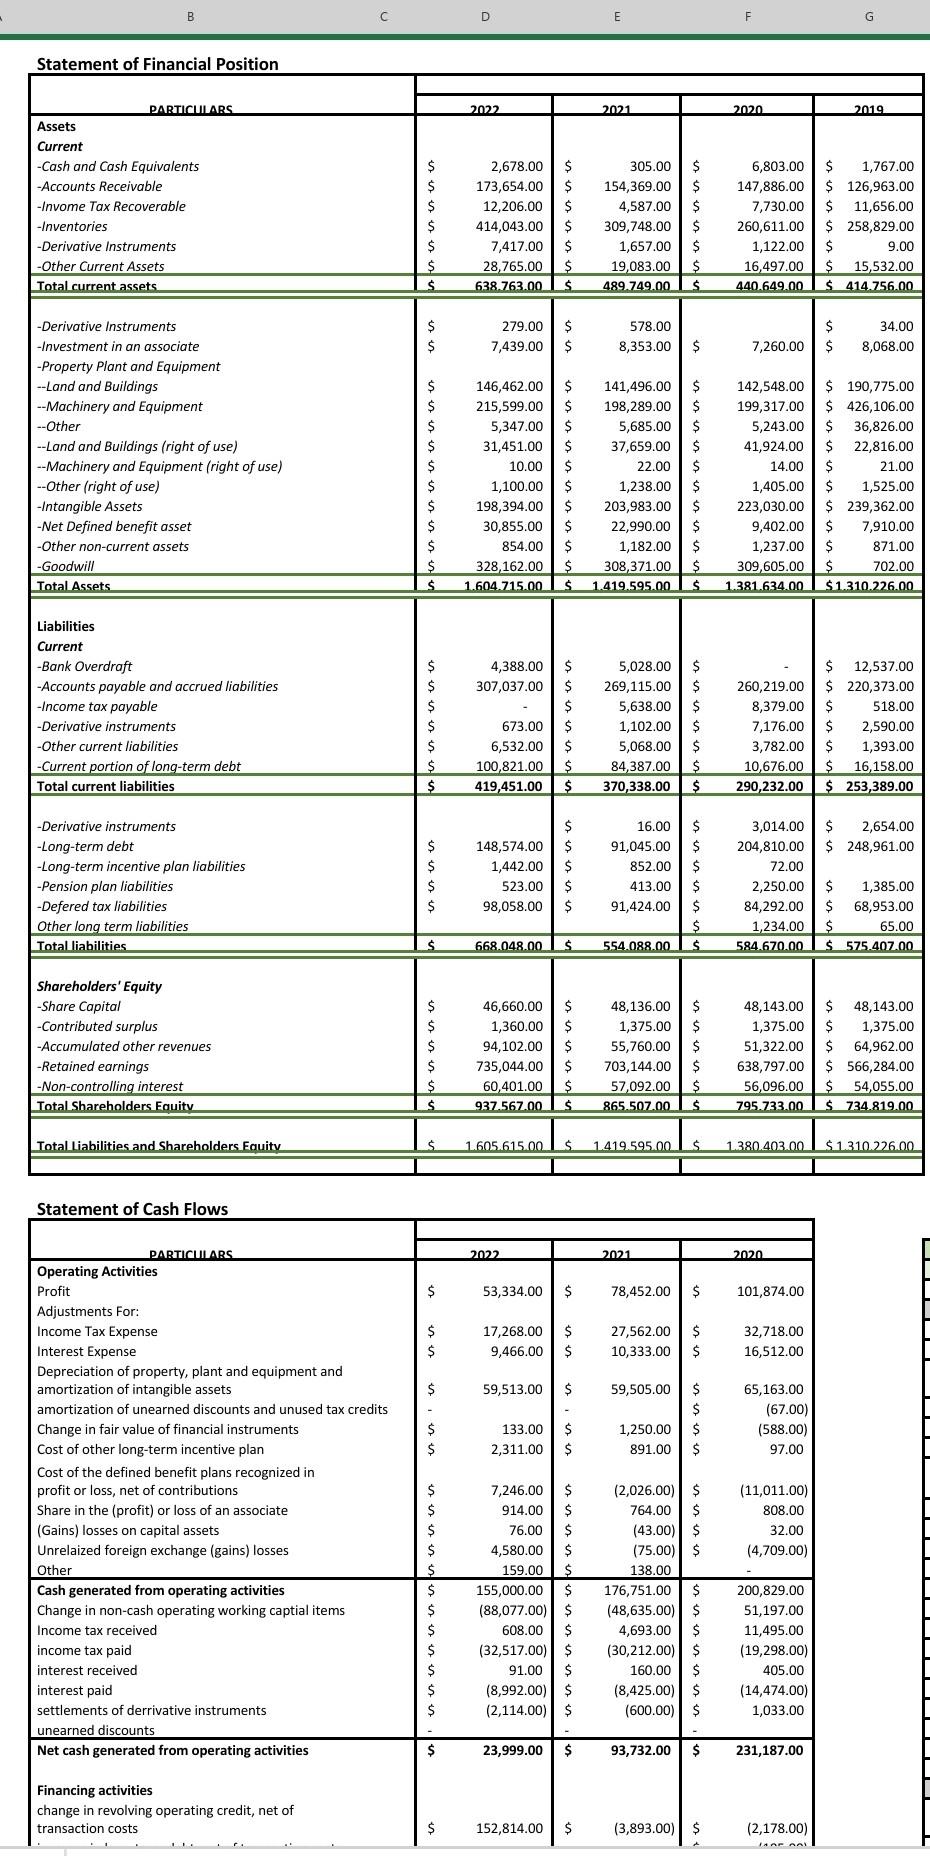
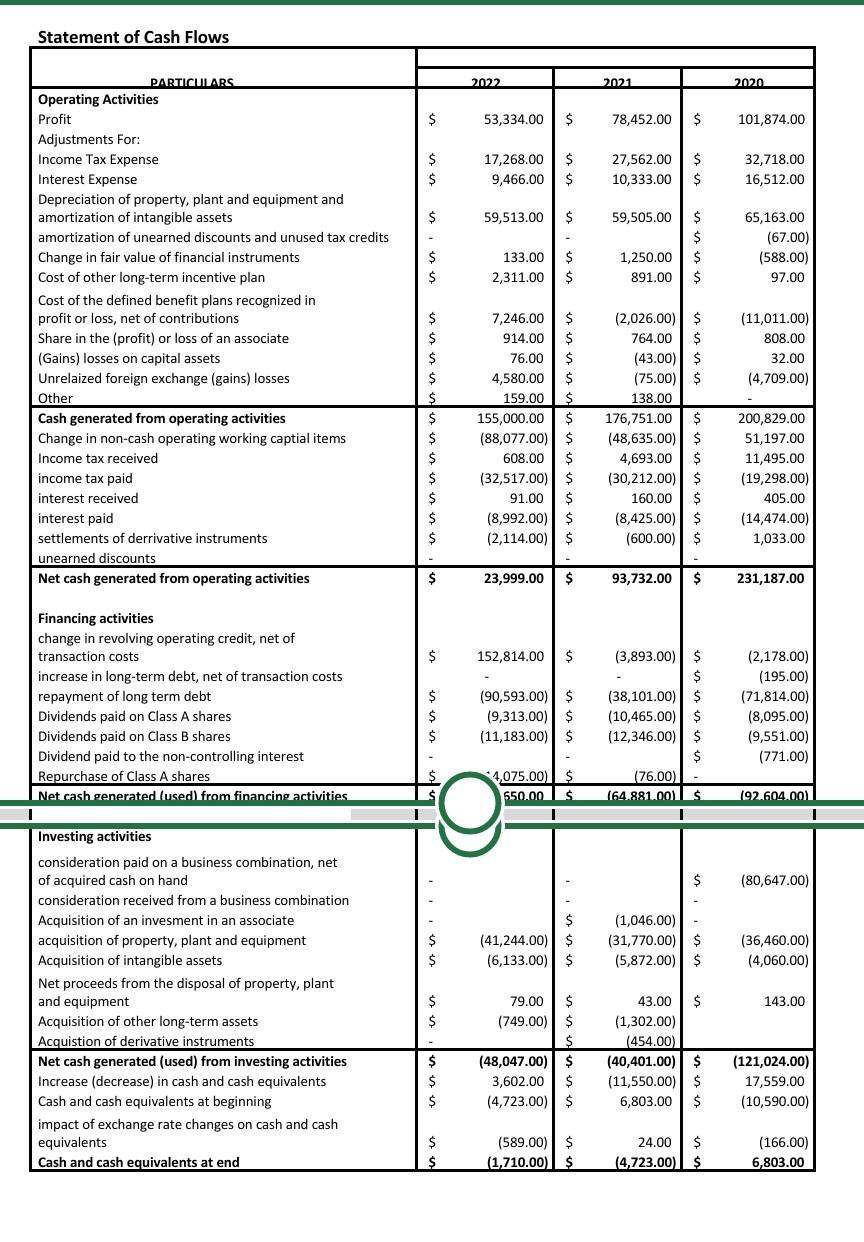
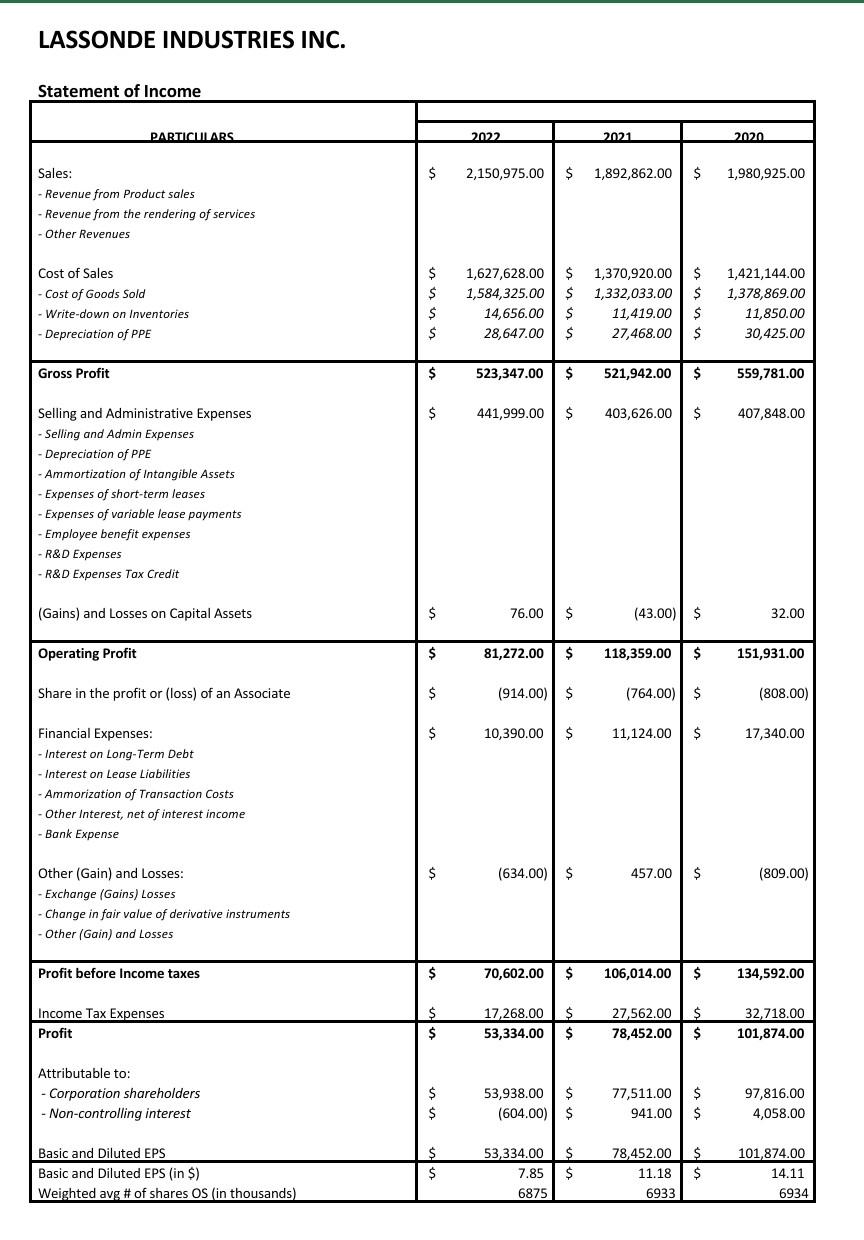
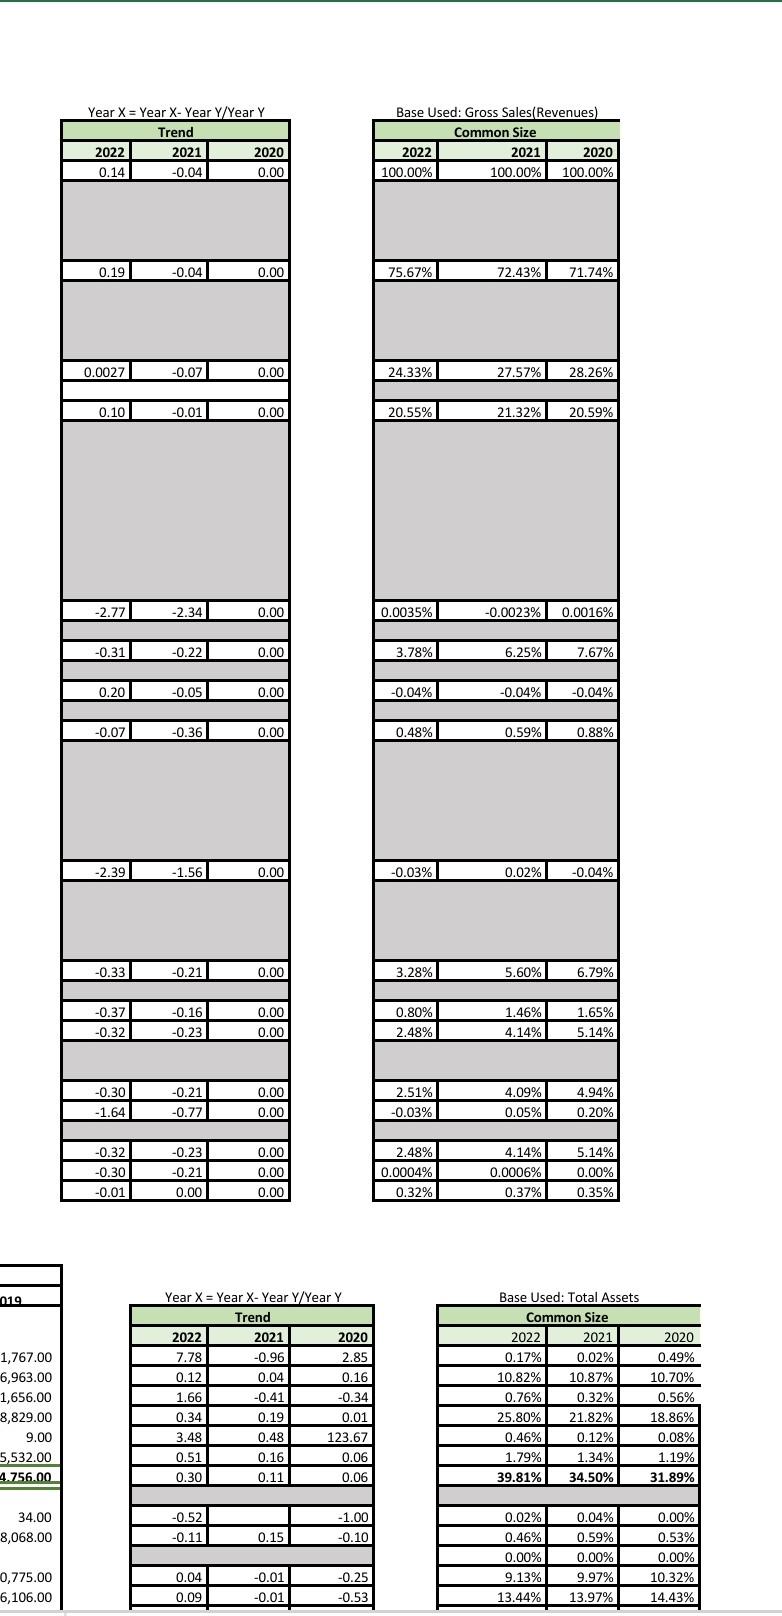
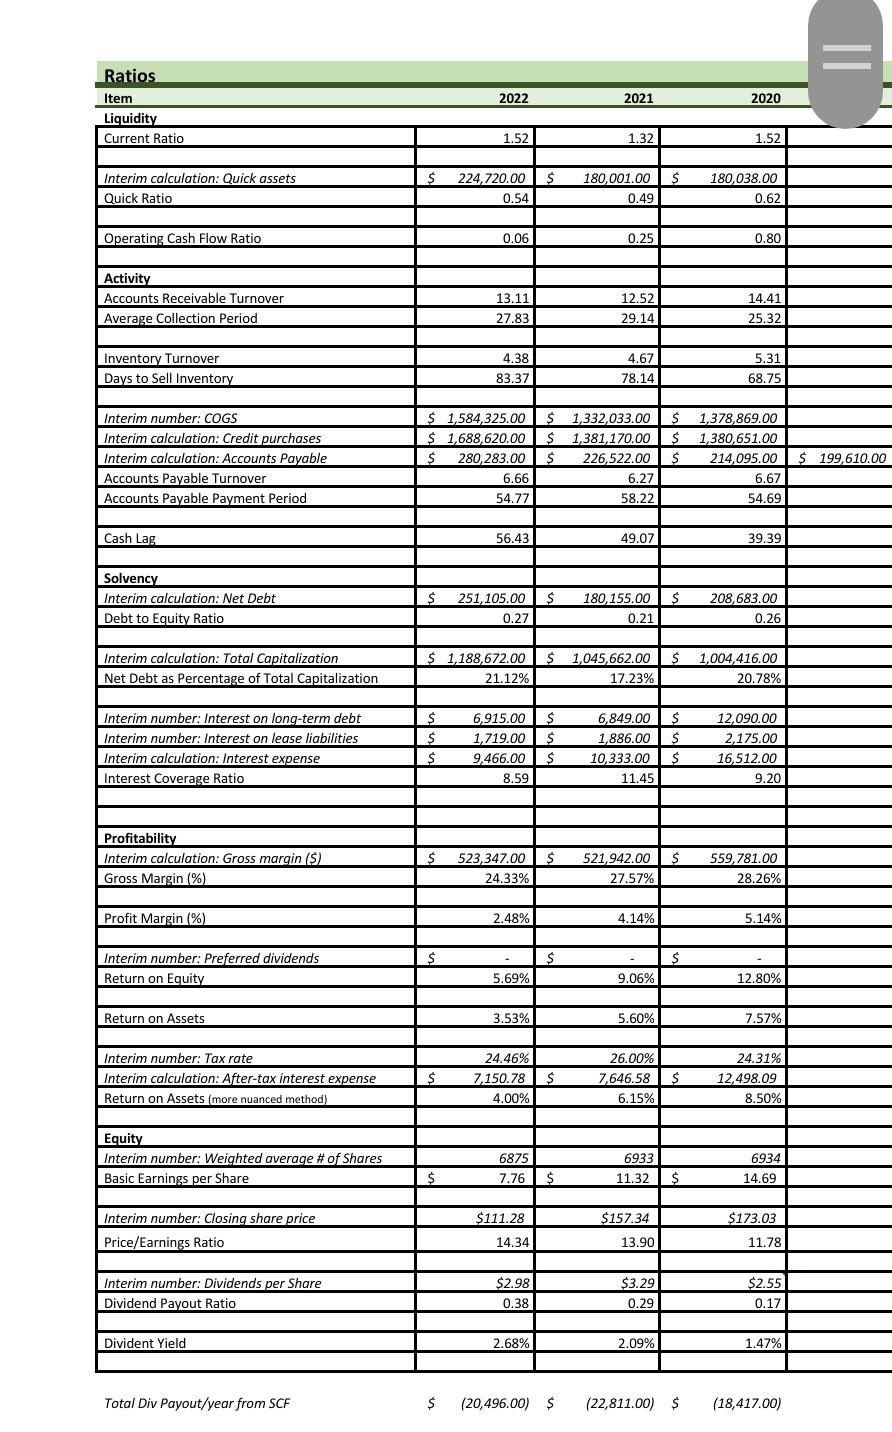
Statement of Cash Flows LASSONDE INDUSTRIES INC. Statement of Income \begin{tabular}{|c|c|c|} \hline \multicolumn{3}{|c|}{ Trend } \\ \hline 2022 & 2021 & 2020 \\ \hline 0.14 & -0.04 & 0.00 \\ \hline 0.19 & -0.04 & 0.00 \\ \hline 0.0027 & 0.07 & 0.00 \\ \hline 0.10 & -0.01 & 0.00 \\ \hline-2.77 & -2.34 & 0.00 \\ \hline-0.31 & -0.22 & 0.00 \\ \hline 0.20 & \begin{tabular}{|c|c|} -0.05 \\ \end{tabular} & 0.00 \\ \hline-0.07 & -0.36 & 0.00 \\ \hline-2.39 & -1.56 & 0.00 \\ \hline-0.33 & -0.21 & 0.00 \\ \hline-0.37 & -0.16 & 0.00 \\ \hline-0.32 & \begin{tabular}{|c|} -0.23 \\ \end{tabular} & 0.00 \\ \hline-0.30 & -0.21 & 0.00 \\ \hline-1.64 & -0.77 & 0.00 \\ \hline \begin{aligned}-0.32 \\ \end{aligned} & -0.23 & 0.00 \\ \hline-0.30 & -0.21 & 0.00 \\ \hline-0.01 & 0.00 & 0.00 \\ \hline \end{tabular} \begin{tabular}{|c|c|c|c|c|c|} \hline & \multicolumn{3}{|c|}{ Assets } \\ \hline \multicolumn{3}{|c|}{ Trend } & \multicolumn{3}{|c|}{ Common Size } \\ \hline 2022 & 2021 & 2020 & 2022 & & 2020 \\ \hline 7.78 & -0.96 & 2.85 & 0.17% & 0.02% & 0.49% \\ \hline 0.12 & 0.04 & 0.16 & 10.82% & 10.87% & 10.70% \\ \hline 1.66 & --0.41 & -0.34 & 0.76% & 0.32% & 0.56% \\ \hline 0.34 & 0.19 & 0.01 & 25.80% & 21.82% & 18.86% \\ \hline 3.48 & 0.48 & 123.67 & 0.46% & 0.12% & 0.08% \\ \hline 0.51 & 0.16 & 0.06 & \begin{tabular}{l} 0.40% \\ .79% \\ \end{tabular} & 1.34%1.12% & 1.19% \\ \hline 0.30 & 0.11 & 0.06 & 39.81% & 34.50% & 31.89% \\ \hline & & -100 & 0.02% & & 0.00% \\ \hline-0.11 & 0.15 & \begin{tabular}{ll} -0.10 \\ \end{tabular} & \begin{tabular}{l} 0.46% \\ 0.46% \\ \end{tabular} & 0.59%0.54% & 0.53% \\ \hline & & & 0.00% & 0.00% & 0.00% \\ \hline 0.04 & -0.01 & -0.25 & 9.13% & 9.97% & 10.32% \\ \hline 0.09 & --0.01 & -0.53 & 13.44% & 13.97% & 14.43% \\ \hline \end{tabular} Total Div Payout/year from SCF
Step by Step Solution
There are 3 Steps involved in it
Step: 1

Get Instant Access to Expert-Tailored Solutions
See step-by-step solutions with expert insights and AI powered tools for academic success
Step: 2

Step: 3

Ace Your Homework with AI
Get the answers you need in no time with our AI-driven, step-by-step assistance
Get Started


