Question: Here is the text book information, trend needs to be return on investment Calculate one financial statement ratio trend within your industry that warrants improvement

Here is the text book information, trend needs to be return on investment
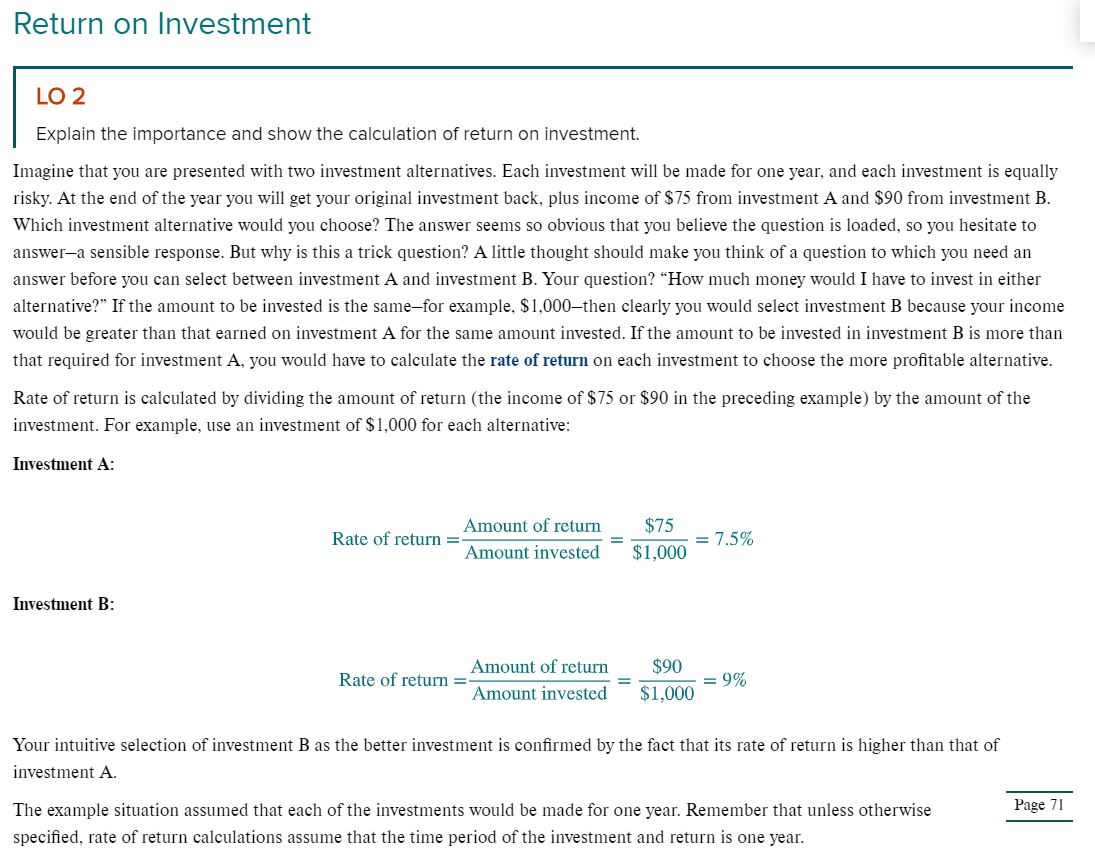
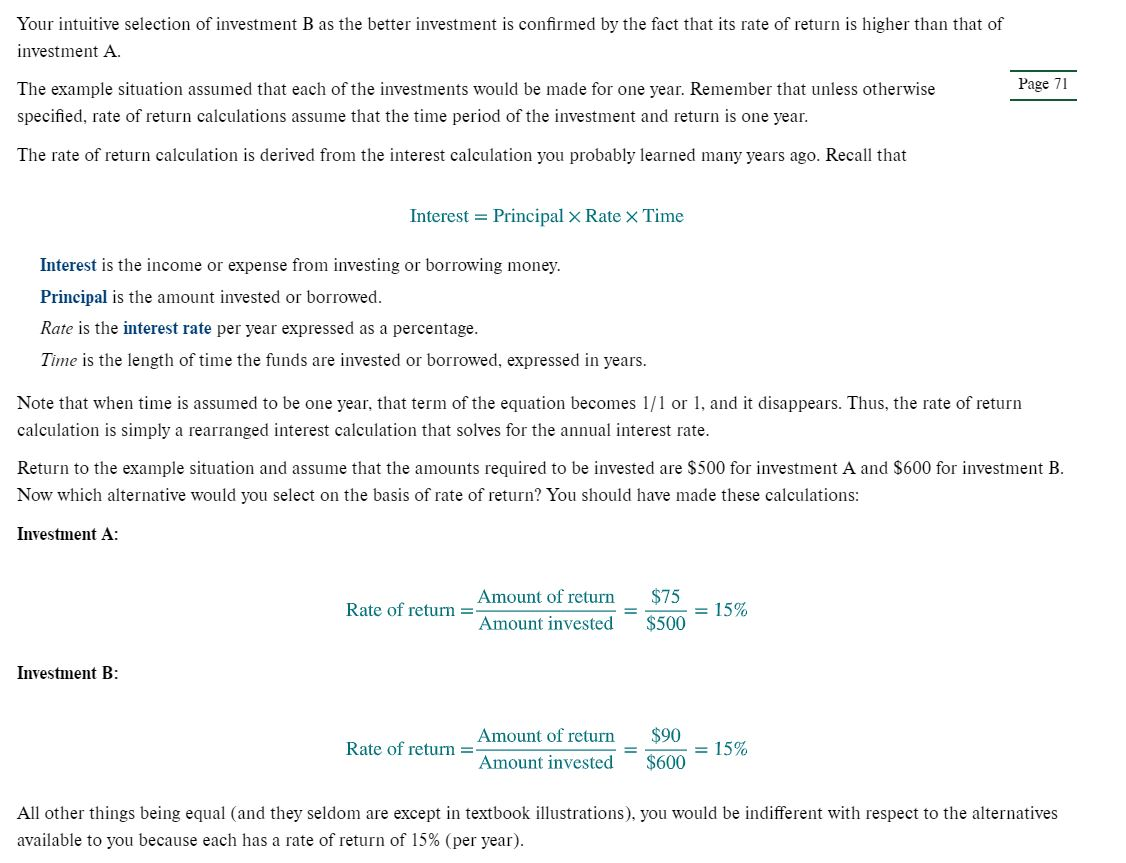
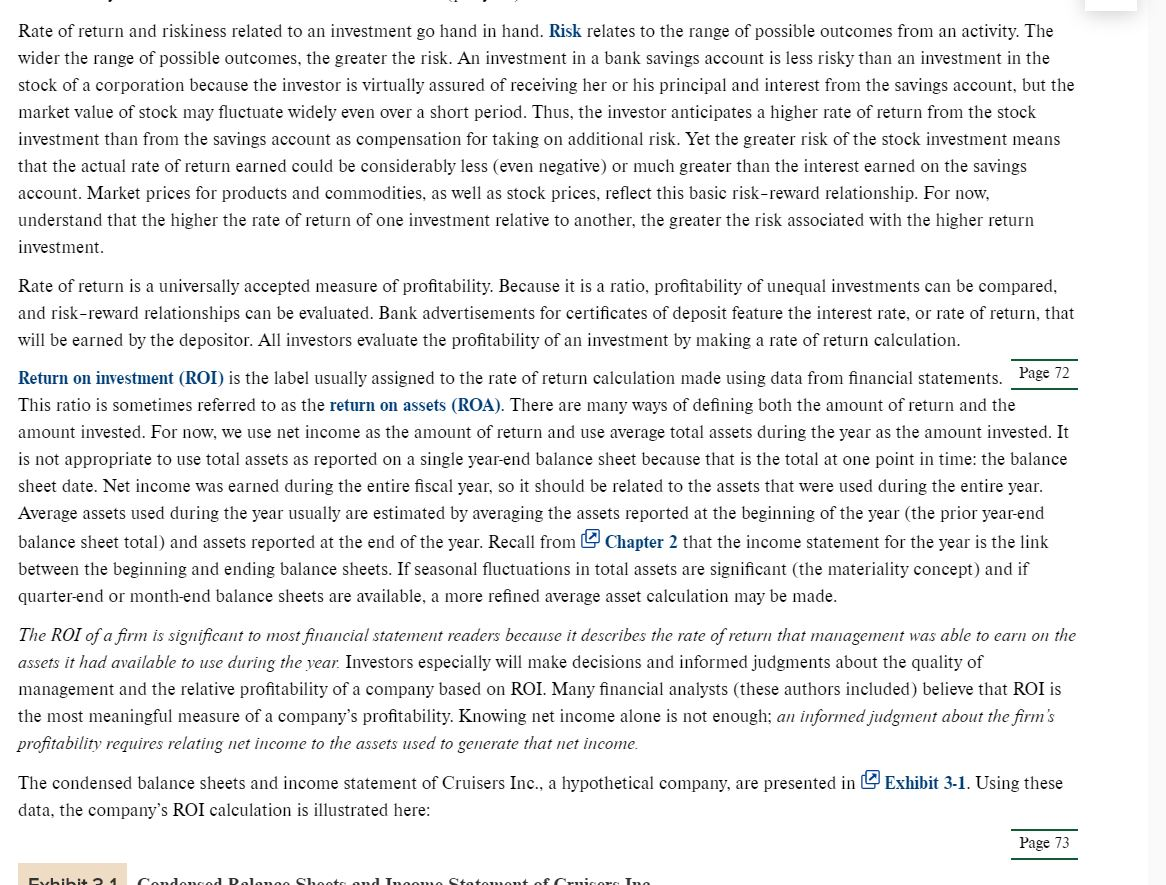
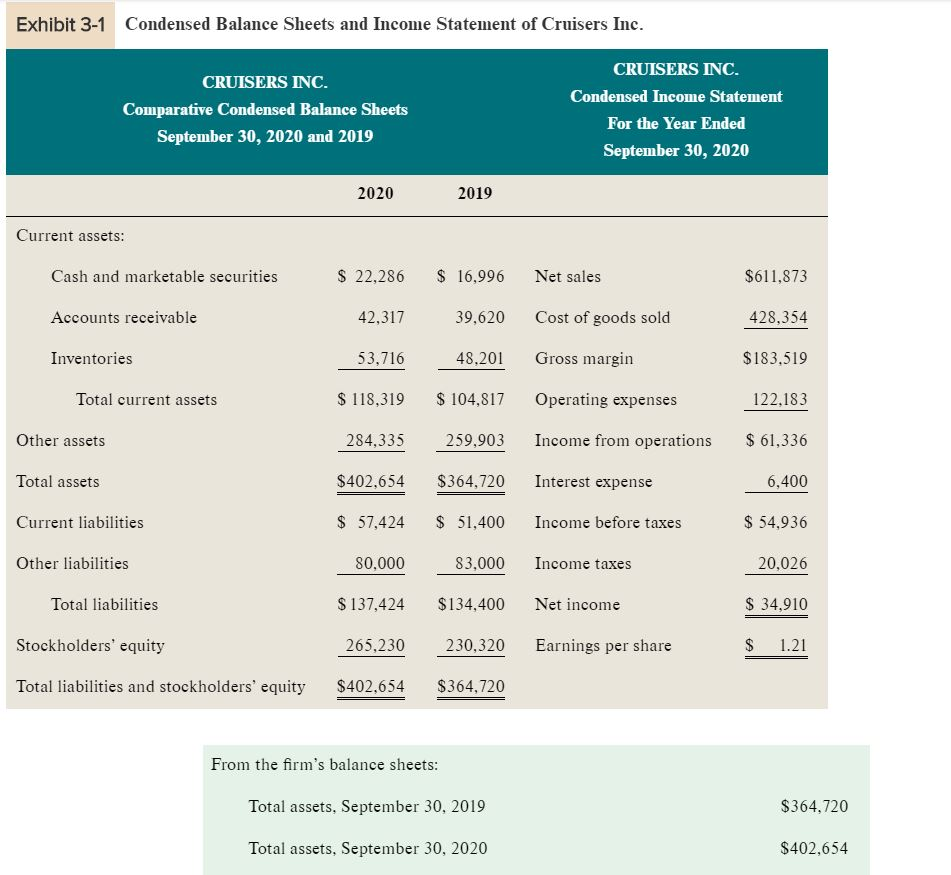
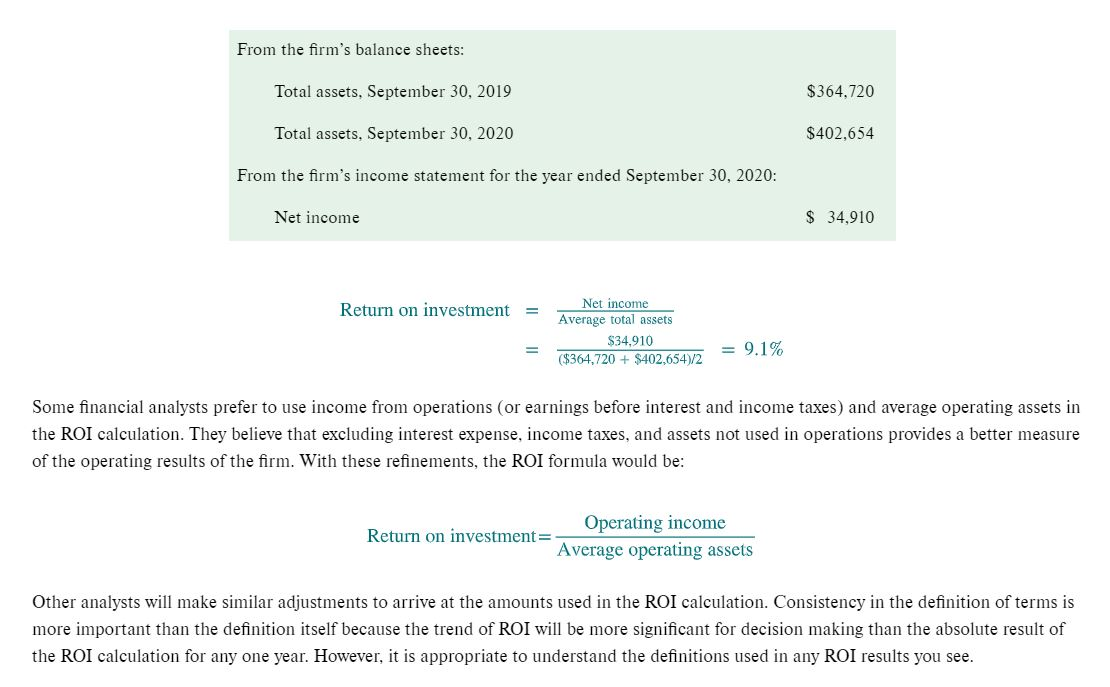
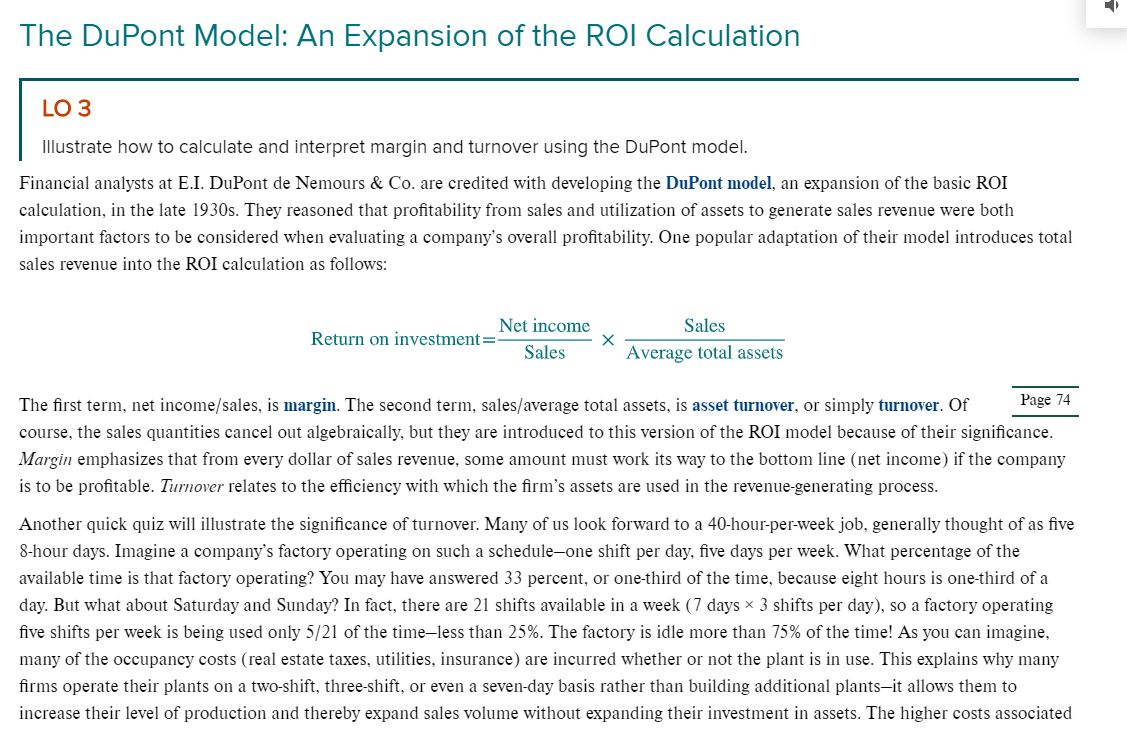
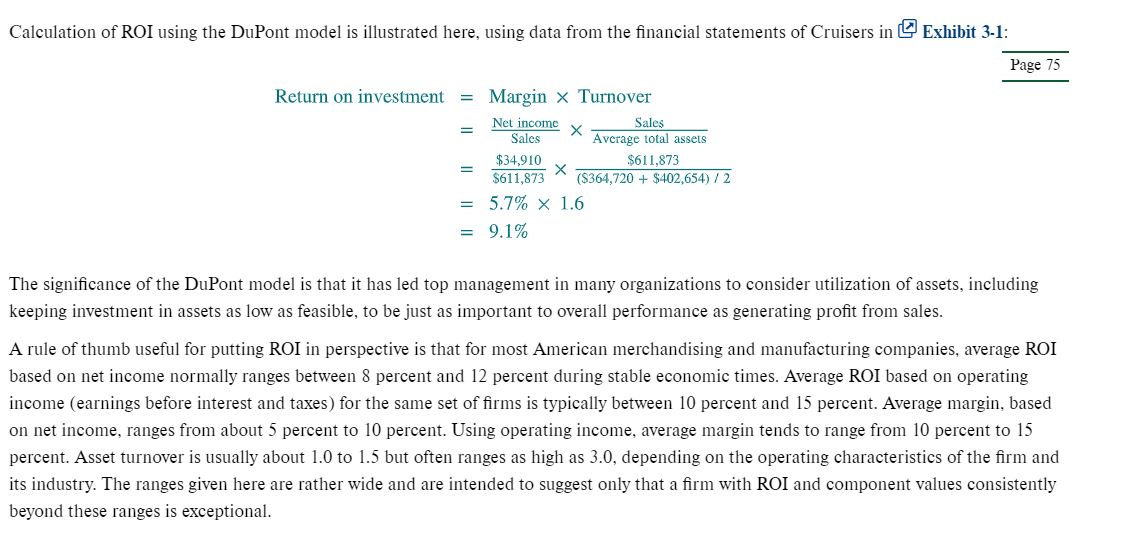
Calculate one financial statement ratio trend within your industry that warrants improvement efforts. Make up your own. Return on Investment LO 2 Explain the importance and show the calculation of return on investment. Imagine that you are presented with two investment alternatives. Each investment will be made for one year, and each investment is equally risky. At the end of the year you will get your original investment back, plus income of $75 from investment A and $90 from investment B. Which investment alternative would you choose? The answer seems so obvious that you believe the question is loaded, so you hesitate to answer-a sensible response. But why is this a trick question? A little thought should make you think of a question to which you need an answer before you can select between investment A and investment B. Your question? "How much money would I have to invest in either alternative?" If the amount to be invested is the same-for example, $1,000then clearly you would select investment B because your income would be greater than that earned on investment A for the same amount invested. If the amount to be invested in investment B is more than that required for investment A, you would have to calculate the rate of return on each investment to choose the more profitable alternative. Rate of return is calculated by dividing the amount of return the income of $75 or $90 in the preceding example) by the amount of the investment. For example, use an investment of $1,000 for each alternative: Investment A: Rate of return = Amount of return Amount invested $75 75% $1,000 Investment B: Amount of return Rate of return = Amount invested $90 $1,000 Your intuitive selection of investment B as the better investment is confirmed by the fact that its rate of return is higher than that of investment A. Page 71 The example situation assumed that each of the investments would be made for one year. Remember that unless otherwise specified, rate of return calculations assume that the time period of the investment and return is one year. Your intuitive selection of investment B as the better investment is confirmed by the fact that its rate of return is higher than that of investment A. Page 71 The example situation assumed that each of the investments would be made for one year. Remember that unless otherwise specified, rate of return calculations assume that the time period of the investment and return is one year. The rate of return calculation is derived from the interest calculation you probably learned many years ago. Recall that Interest = Principal X Rate x Time Interest is the income or expense from investing or borrowing money. Principal is the amount invested or borrowed. Rate is the interest rate per year expressed as a percentage. Time is the length of time the funds are invested or borrowed, expressed in years. Note that when time is assumed to be one year, that term of the equation becomes 1/1 or 1, and it disappears. Thus, the rate of return calculation is simply a rearranged interest calculation that solves for the annual interest rate. Return to the example situation and assume that the amounts required to be invested are $500 for investment A and $600 for investment B. Now which alternative would you select on the basis of rate of return? You should have made these calculations: Investment A: Rate of return = _Amount of return $75 Amount invested = $500 = 15% Investment B: Amount of return Rate of return = Amount invested $90 $600 All other things being equal (and they seldom are except in textbook illustrations), you would be indifferent with respect to the alternatives available to you because each has a rate of return of 15% (per year). Rate of return and riskiness related to an investment go hand in hand. Risk relates to the range of possible outcomes from an activity. The wider the range of possible outcomes, the greater the risk. An investment in a bank savings account is less risky than an investment in the stock of a corporation because the investor is virtually assured of receiving her or his principal and interest from the savings account, but the market value of stock may fluctuate widely even over a short period. Thus, the investor anticipates a higher rate of return from the stock investment than from the savings account as compensation for taking on additional risk. Yet the greater risk of the stock investment means that the actual rate of return earned could be considerably less (even negative) or much greater than the interest earned on the savings account. Market prices for products and commodities, as well as stock prices, reflect this basic risk-reward relationship. For now, understand that the higher the rate of return of one investment relative to another, the greater the risk associated with the higher return investment. Rate of return is a universally accepted measure of profitability. Because it is a ratio, profitability of unequal investments can be compared, and risk-reward relationships can be evaluated. Bank advertisements for certificates of deposit feature the interest rate, or rate of return, that will be earned by the depositor. All investors evaluate the profitability of an investment by making a rate of return calculation. Return on investment (ROI) is the label usually assigned to the rate of return calculation made using data from financial statements. Page 12 This ratio is sometimes referred to as the return on assets (ROA). There are many ways of defining both the amount of return and the amount invested. For now, we use net income as the amount of return and use average total assets during the year as the amount invested. It is not appropriate to use total assets as reported on a single year-end balance sheet because that is the total at one point in time: the balance sheet date. Net income was earned during the entire fiscal year, so it should be related to the assets that were used during the entire year. Average assets used during the year usually are estimated by averaging the assets reported at the beginning of the year (the prior year-end balance sheet total) and assets reported at the end of the year. Recall from Chapter 2 that the income statement for the year is the link between the beginning and ending balance sheets. If seasonal fluctuations in total assets are significant (the materiality concept) and if quarter-end or month-end balance sheets are available, a more refined average asset calculation may be made. The ROI of a firm is significant to most financial statement readers because it describes the rate of return that management was able to earn on the assets it had available to use during the year. Investors especially will make decisions and informed judgments about the quality of management and the relative profitability of a company based on ROI. Many financial analysts (these authors included) believe that ROI is the most meaningful measure of a company's profitability. Knowing net income alone is not enough; an informed judgment about the firm's profitability requires relating net income to the assets used to generate that net income. Exhibit 3-1. Using these The condensed balance sheets and income statement of Cruisers Inc., a hypothetical company, are presented in data, the company's ROI calculation is illustrated here: Page 73 Exhibit 21 Condomrod Dolanoo Shoot and Income Stotomont of Cruicor In Exhibit 3-1 Condensed Balance Sheets and Income Statement of Cruisers Inc. CRUISERS INC. Comparative Condensed Balance Sheets September 30, 2020 and 2019 CRUISERS INC. Condensed Income Statement For the Year Ended September 30, 2020 2020 2019 Current assets: Cash and marketable securities $ 22,286 $ 16,996 Net sales $611,873 Accounts receivable 42,317 39,620 Cost of goods sold 428,354 Inventories 53,716 48.201 Gross margin $183,519 Total current assets $ 118,319 $ 104,817 Operating expenses 122.183 Other assets 284,335 259,903 Income from operations $ 61,336 Total assets $402,654 $364,720 Interest expense 6,400 Current liabilities $ 57,424 $ 51,400 Income before taxes $ 54,936 Other liabilities 80.000 83,000 Income taxes 20,026 Total liabilities $ 137,424 $134,400 Net income $ 34,910 Stockholders' equity 265,230 230,320 Earnings per share $ 1.21 Total liabilities and stockholders' equity $402,654 $364,720 From the firm's balance sheets: Total assets, September 30, 2019 $364,720 Total assets, September 30, 2020 $402,654 From the firm's balance sheets: Total assets. September 30, 2019 $364,720 Total assets, September 30, 2020 $402,654 From the firm's income statement for the year ended September 30, 2020: Net income $ 34,910 Return on investment = Net income Average total assets $34,910 ($364.720 + $402.65412 = 9.1% Some financial analysts prefer to use income from operations (or earnings before interest and income taxes) and average operating assets in the ROI calculation. They believe that excluding interest expense, income taxes, and assets not used in operations provides a better measure of the operating results of the firm. With these refinements, the ROI formula would be: Operating income Return on investment= Average operating assets Other analysts will make similar adjustments to arrive at the amounts used in the ROI calculation. Consistency in the definition of terms is more important than the definition itself because the trend of ROI will be more significant for decision making than the absolute result of the ROI calculation for any one year. However, it is appropriate to understand the definitions used in any ROI results you see. The DuPont Model: An Expansion of the ROI Calculation LO 3 Illustrate how to calculate and interpret margin and turnover using the DuPont model. Financial analysts at E.I. DuPont de Nemours & Co. are credited with developing the DuPont model, an expansion of the basic ROI calculation, in the late 1930s. They reasoned that profitability from sales and utilization of assets to generate sales revenue were both important factors to be considered when evaluating a company's overall profitability. One popular adaptation of their model introduces total sales revenue into the ROI calculation as follows: Net income Return on investment= Sales Average total assets Sales The first term, net income/sales, is margin. The second term, sales/average total assets, is asset turnover, or simply turnover. Of Page course, the sales quantities cancel out algebraically, but they are introduced to this version of the ROI model because of their significance. Margin emphasizes that from every dollar of sales revenue, some amount must work its way to the bottom line (net income) if the company is to be profitable. Turnover relates to the efficiency with which the firm's assets are used in the revenue-generating process. Another quick quiz will illustrate the significance of turnover. Many of us look forward to a 40-hour-per-week job, generally thought of as five 8-hour days. Imagine a company's factory operating on such a schedule-one shift per day, five days per week. What percentage of the available time is that factory operating? You may have answered 33 percent, or one-third of the time, because eight hours is one-third of a day. But what about Saturday and Sunday? In fact, there are 21 shifts available in a week (7 days * 3 shifts per day), so a factory operating five shifts per week is being used only 5/21 of the time-less than 25%. The factory is idle more than 75% of the time! As you can imagine, many of the occupancy costs (real estate taxes, utilities, insurance) are incurred whether or not the plant is in use. This explains why many firms operate their plants on a two-shift, three-shift, or even a seven-day basis rather than building additional plants-it allows them to increase their level of production and thereby expand sales volume without expanding their investment in assets. The higher costs associated Calculation of ROI using the DuPont model is illustrated here, using data from the financial statements of Cruisers in Exhibit 3-1: Page 75 Return on investment = Margin X Turnover Sales Net income X Average total assets $34,910 $611,873 = $611,873 * ($364,720 + $402,654) / 2 = 5.7% X 1.6 = 9.1% The significance of the DuPont model is that it has led top management in many organizations to consider utilization of assets, including keeping investment in assets as low as feasible, to be just as important to overall performance as generating profit from sales. A rule of thumb useful for putting ROI in perspective is that for most American merchandising and manufacturing companies, average ROI based on net income normally ranges between 8 percent and 12 percent during stable economic times. Average ROI based on operating income (earnings before interest and taxes) for the same set of firms is typically between 10 percent and 15 percent. Average margin, based on net income, ranges from about 5 percent to 10 percent. Using operating income, average margin tends to range from 10 percent to 15 percent. Asset turnover is usually about 1.0 to 1.5 but often ranges as high as 3.0, depending on the operating characteristics of the firm and its industry. The ranges given here are rather wide and are intended to suggest only that a firm with ROI and component values consistently beyond these ranges is exceptional
Step by Step Solution
There are 3 Steps involved in it

Get step-by-step solutions from verified subject matter experts


