

Question: here we have to creat a radiation heatmap. i havw added the pictures of all the instructions. please do the function in matlab. and also
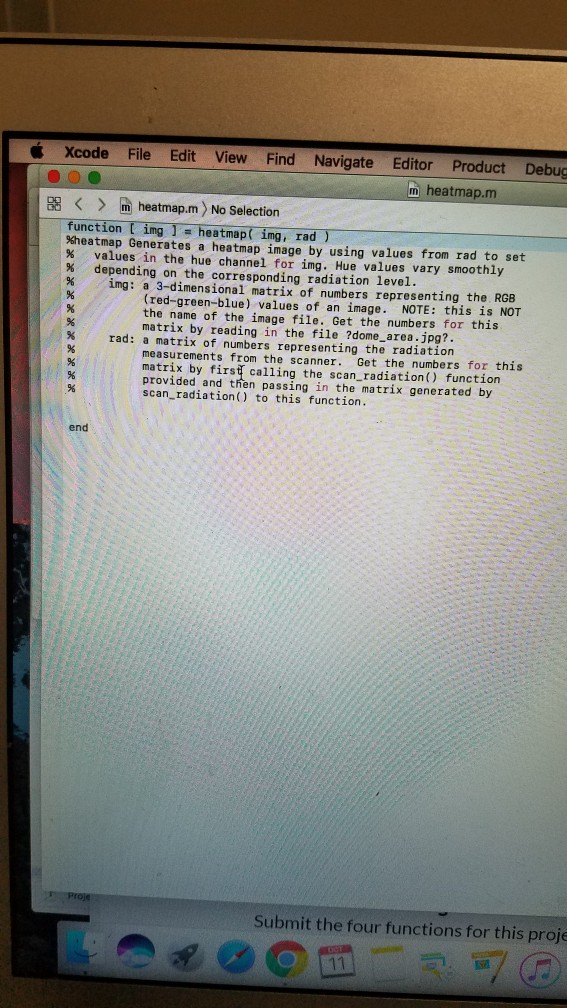
here we have to creat a radiation heatmap. i havw added the pictures of all the instructions. please do the function in matlab. and also try to follow the picture #4 while writing the heatmap.m.
thank you.
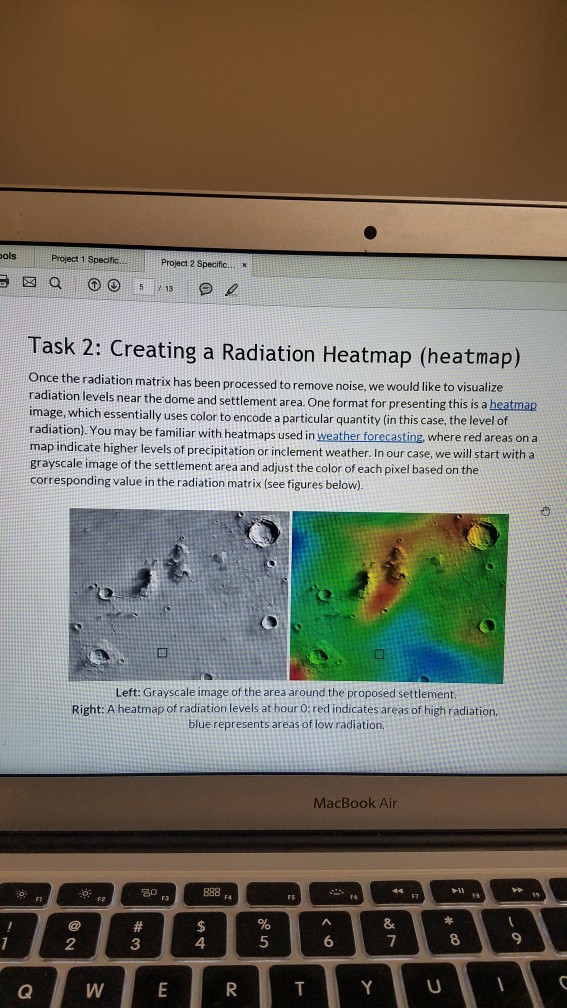
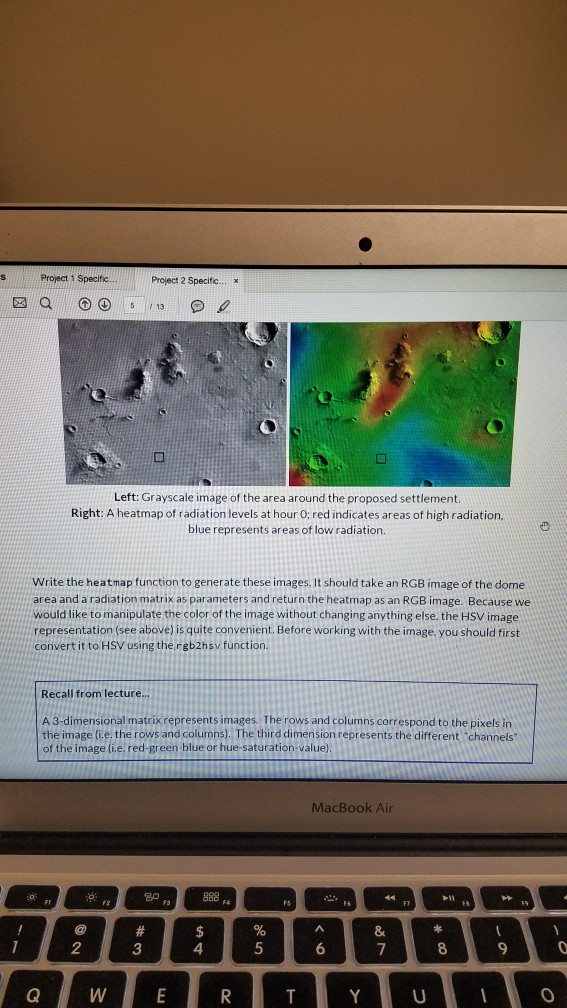
Project 1 Specific.. Project 2 Specific... X Task 2: Creating a Radiation Heatmap (heatmap) Once the rad radiation levels near the dome and settlement area. One format for presenting this is a mage, which radiation). You may be familiar with heatmaps used in weather forecasting map indicate higher levels of precipitation or inclement weather. In our case, we will start with a grayscale image of the settlement area and adjust the color of each pixel based on the corresponding value in the radiation matrix (see figures below). iation matrix has been processed to remove noise, we would like to visualize heatmap essentially uses color to encode a particular quantity (in this case, the level of where red areas on a Left: Grayscale image of the area around the proposed settlement Right: A heatmap of radiation levels at hour O:red indicates areas of high radiation, blue represents areas of low radiation. MacBook Air 8 2 3 4
Step by Step Solution
There are 3 Steps involved in it

Get step-by-step solutions from verified subject matter experts