Hertz (NYSE: HTZ) is a car and equipment rental company. The car rental segment operates a
fleet of approximately 285,000 cars in the United States and 150,000 cars internationally. The
companys average holding period for a rental car is fifteen months in the United States and
twelve months internationally. Hertz acquires many of its cars as programs cars. For
program cars, the manufacturers agree to repurchase the cars at a specified price, which is
generally based on a predetermined percentage of the original car cost. This program limits
Hertzs residual risk; however, typically the acquisition cost is higher for these program cars.
The company was founded in 1918 and is headquartered in Park Ridge, New Jersey.
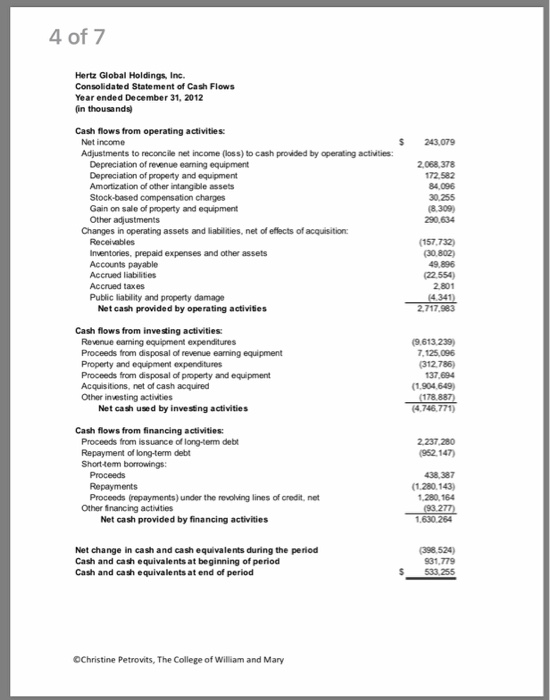
Hertz makes five adjustments (ignoring Other adjustments) to net income before including
the changes in operating assets and liabilities. List each of these five items and briefly
explain why each of these items is added (subtracted) from net income to calculate Net Cash
Provided by Operating Activities.
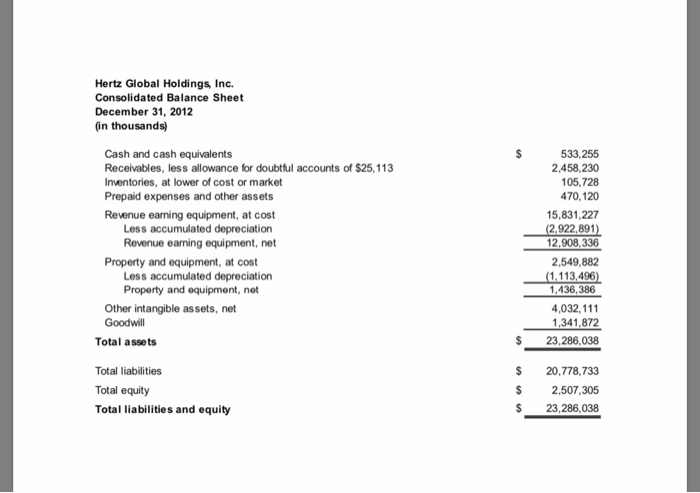
2) Did receivables increase or decrease from the end of 2011 to the end of 2012? Did accrued
liabilities increase or decrease from the end of 2011 to the end of 2012?
3) How much cash did Hertz pay out to investors in the form of dividends and/or share
repurchases in 2012? (Ignore other financing activities.)
4) What is the largest asset reported on Hertzs balance sheet? Notice that Hertz does not
separately classify assets as current and long-term. Do you think the largest asset is a
current or long-term asset? Why?
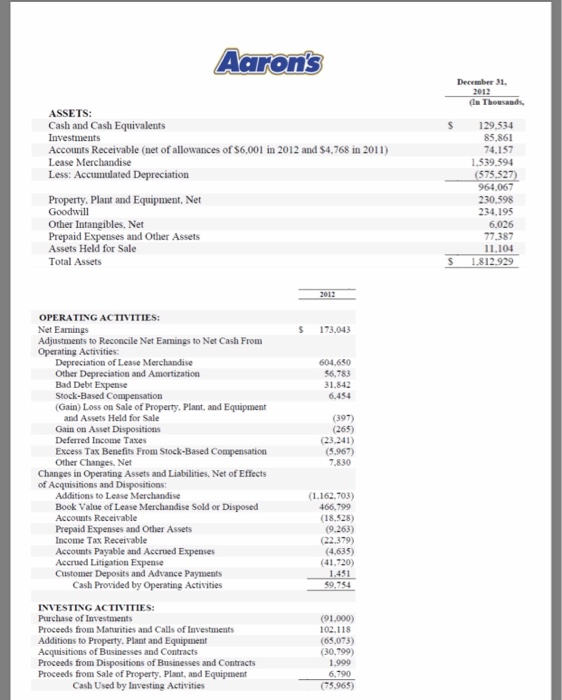
Hertz Global Holdings Inc. Consolidated Balance Sheet December 31, 2012 (in thousands) 533,255 2,458,230 105,728 470,120 15,831,227 2,922,891 2,908,336 2,549,882 1,113,496 1,436,386 4,032,111 1,341,872 $ 23,286,038 Cash and cash equivalents Receivables, less allowance for doubtful accounts of $25,113 Inventories, at lower of cost or market Prepaid expenses and other assets Revenue eaming equipment, at cost Less accumulated depreciation Revenue eaning equipment, net Property and equipment, at cost Less accumulated depreciation Property and equipment, net Other intangible assets, net Goodwill Total assets Total liabilities Total equity Total liabilities and equity 20,778,733 2,507,305 $ 23,286,038 4 of 7 Hertz Global Holdings, Inc. Consolidated Statement of Cash Flows Year ended December 31, 2012 in thousands Cash flows from operating activities: $ 243.079 Net income Adjustments to reconcile net income (loss) to cash provided by operating activities Depreciation of revenue eaning equipment Depreciation of property and equipment Amortization of other intangible assets Stock-based compensation charges Gain on sale of property and equipment Other adjustments 2,068, 378 172.582 84,096 (8.309) 290.634 Changes in operating assets and liabilities, net of eflects of acquisition 157,732) 30.802) 49.896 (22,554) 2.801 Inventories, prepaid expenses and other assets Accounts payable Accrued liabilities Accrued taxes Public liability and property damage Net cash provided by operating activities 2,717,983 Cash flows from investing activities: (9613.239 Revenue earning equipment expenditures Proceeds from disposal of revenue eaming equipment Property and equipment expenditures Proceeds firom disposal of property and equipment Acquisitions, net of cash acquired Other investing activities 7,125,096 312.786) 137,694 1,904,649 Net cash used by invesing activities 4,746,771) Cash flows from financing activities: Proceeds from is suance of long-term debt Repayment of long-term debt 2.237.280 962 147) 438,387 (1.280.143) 1,280.164 Proceeds (repayments) under the revolving lines of credit, net Other inancing actities (93 277 1.630 264 Net cash provided by financing activities 398 524) 31 779 533,255 Net change in cash and cash equivalents during the period Cash and cash equivalents at beginning of period Cash and cash equivalents at end of period S OChristine Petrovits, The College of William and Mary Coinstar Dec. 31 2012 Current Assets: Cash and cash equivalents Accounts receivable, net of alowances of $2,003 and $1,586 Content ibrary Deferred income taxes Prepaid expenses and other current assets S 282,894 58,331 177 409 7.187 555 507 571 358 26,731 1373 358829 47,927 1,561,725 Total current assets Property and equipment, net Notes receivable Deferred income taxes Goodwil and other intangible assets Other long-term assets Total assets S 2012 Operating Activities: Net income Adjustments to re concile net income to net cash lows from operating activities from continuing operations: Depreciation and other Amortization of intangible asset Share-based payments expense S 150,230 179,147 7504 Cash flows from changes in operating assets and Eabilities: Accounts receivable Content lbrary Prepaid expenses and other current assets Other assets Accounts payable Accrued payable to retailers Other accrued liablities Net cash flows from operating activties (17,061) (30,693) (6,963) 10,461 2787 Investing Activities: Purchases of property and equipment Proceeds from sale of property and equipment Acquisition of NCR DVD kiosk business (208,054) 1131 (100,000) S (346650) $156,063 PROPERTY AND EQUIPMENT, AT COST Furniture, fixtures and equipment $ 132,063,000 Tuxedo rental product amortization Loss on disposition of assets Changesin operating assets and liabilities: Accounts payable, accrued expenses and other current 721.000 S225,730, 000 Net cash provided by operating activities Investment in trademarks, tradenames and other assets Proceeds from sales of property and equipment 33,000 ueatioiing octhege of William and Maby (123,475,000) Aarons DecembeT 31 ASSETS: Cash and Cash Equivalents Investments Accounts Receivable (net of allowances of S6,001 in 2012 and $4,768 in 2011) Lease Merchandise 129,534 85,861 4,157 1539594 964.067 230.598 234.195 6.026 7387 11.104 Property, Plant and Equipment, Net Goodwill Other Intangibles, Net Prepaid Expenses and Other Assets Assets Held for Sale Total Assets OPERATING ACTIVITIES: Net Eamings Adjustments to Reconcile Net Earnings to Net Cash From Operating Activities: 173.043 Depreciation of Lease Merchandise Other Depreciation and Amortization Bad Debt Expense Stock-Based Compensation (Gain) Loss on Sale of Property. Plant, and Equipment 604.630 56,783 31.842 6.454 and Assets Held for Sale Gain on Asset Dispositions Deferred Income Taxes Excess Tax Benefits From Stock-Based Compensation Other Changes, Net (397) (265) 23,241) (5,967) 7.830 Changes in Operating Assets and Liabilities, Net of Effects of Acquisitions and Dispositions: Additions to Lease Merchandise Book Value of Lease Merchandise Sold or Disposed Accounts Receivable Prepaid Expenses and Other Assets Income Tax Receivable Accounts Payable and Accrued Expenses Accrued Litigation Expense Customer Deposits and Advance Payments 1.162,703) 466,799 (18,528) (9.263) (22.379) (4,635) (41,720) Cash Provided by Operating Activities INVESTING ACTIVITIES: Purchase of Investments Proceeds from Maturities and Calls of Investments Additions to Property. Plant and Equipment Acquisitions of Businesses and Contracts Proceeds from Dispositions of Businesses and Contracts Proceeds from Sale of Property, Plant, and Equipment (91,000) 102.118 (65,073) (30,799) 1.999 6,790 (75.965) Cash Used by Investing Activities Hertz Global Holdings Inc. Consolidated Balance Sheet December 31, 2012 (in thousands) 533,255 2,458,230 105,728 470,120 15,831,227 2,922,891 2,908,336 2,549,882 1,113,496 1,436,386 4,032,111 1,341,872 $ 23,286,038 Cash and cash equivalents Receivables, less allowance for doubtful accounts of $25,113 Inventories, at lower of cost or market Prepaid expenses and other assets Revenue eaming equipment, at cost Less accumulated depreciation Revenue eaning equipment, net Property and equipment, at cost Less accumulated depreciation Property and equipment, net Other intangible assets, net Goodwill Total assets Total liabilities Total equity Total liabilities and equity 20,778,733 2,507,305 $ 23,286,038 4 of 7 Hertz Global Holdings, Inc. Consolidated Statement of Cash Flows Year ended December 31, 2012 in thousands Cash flows from operating activities: $ 243.079 Net income Adjustments to reconcile net income (loss) to cash provided by operating activities Depreciation of revenue eaning equipment Depreciation of property and equipment Amortization of other intangible assets Stock-based compensation charges Gain on sale of property and equipment Other adjustments 2,068, 378 172.582 84,096 (8.309) 290.634 Changes in operating assets and liabilities, net of eflects of acquisition 157,732) 30.802) 49.896 (22,554) 2.801 Inventories, prepaid expenses and other assets Accounts payable Accrued liabilities Accrued taxes Public liability and property damage Net cash provided by operating activities 2,717,983 Cash flows from investing activities: (9613.239 Revenue earning equipment expenditures Proceeds from disposal of revenue eaming equipment Property and equipment expenditures Proceeds firom disposal of property and equipment Acquisitions, net of cash acquired Other investing activities 7,125,096 312.786) 137,694 1,904,649 Net cash used by invesing activities 4,746,771) Cash flows from financing activities: Proceeds from is suance of long-term debt Repayment of long-term debt 2.237.280 962 147) 438,387 (1.280.143) 1,280.164 Proceeds (repayments) under the revolving lines of credit, net Other inancing actities (93 277 1.630 264 Net cash provided by financing activities 398 524) 31 779 533,255 Net change in cash and cash equivalents during the period Cash and cash equivalents at beginning of period Cash and cash equivalents at end of period S OChristine Petrovits, The College of William and Mary Coinstar Dec. 31 2012 Current Assets: Cash and cash equivalents Accounts receivable, net of alowances of $2,003 and $1,586 Content ibrary Deferred income taxes Prepaid expenses and other current assets S 282,894 58,331 177 409 7.187 555 507 571 358 26,731 1373 358829 47,927 1,561,725 Total current assets Property and equipment, net Notes receivable Deferred income taxes Goodwil and other intangible assets Other long-term assets Total assets S 2012 Operating Activities: Net income Adjustments to re concile net income to net cash lows from operating activities from continuing operations: Depreciation and other Amortization of intangible asset Share-based payments expense S 150,230 179,147 7504 Cash flows from changes in operating assets and Eabilities: Accounts receivable Content lbrary Prepaid expenses and other current assets Other assets Accounts payable Accrued payable to retailers Other accrued liablities Net cash flows from operating activties (17,061) (30,693) (6,963) 10,461 2787 Investing Activities: Purchases of property and equipment Proceeds from sale of property and equipment Acquisition of NCR DVD kiosk business (208,054) 1131 (100,000) S (346650) $156,063 PROPERTY AND EQUIPMENT, AT COST Furniture, fixtures and equipment $ 132,063,000 Tuxedo rental product amortization Loss on disposition of assets Changesin operating assets and liabilities: Accounts payable, accrued expenses and other current 721.000 S225,730, 000 Net cash provided by operating activities Investment in trademarks, tradenames and other assets Proceeds from sales of property and equipment 33,000 ueatioiing octhege of William and Maby (123,475,000) Aarons DecembeT 31 ASSETS: Cash and Cash Equivalents Investments Accounts Receivable (net of allowances of S6,001 in 2012 and $4,768 in 2011) Lease Merchandise 129,534 85,861 4,157 1539594 964.067 230.598 234.195 6.026 7387 11.104 Property, Plant and Equipment, Net Goodwill Other Intangibles, Net Prepaid Expenses and Other Assets Assets Held for Sale Total Assets OPERATING ACTIVITIES: Net Eamings Adjustments to Reconcile Net Earnings to Net Cash From Operating Activities: 173.043 Depreciation of Lease Merchandise Other Depreciation and Amortization Bad Debt Expense Stock-Based Compensation (Gain) Loss on Sale of Property. Plant, and Equipment 604.630 56,783 31.842 6.454 and Assets Held for Sale Gain on Asset Dispositions Deferred Income Taxes Excess Tax Benefits From Stock-Based Compensation Other Changes, Net (397) (265) 23,241) (5,967) 7.830 Changes in Operating Assets and Liabilities, Net of Effects of Acquisitions and Dispositions: Additions to Lease Merchandise Book Value of Lease Merchandise Sold or Disposed Accounts Receivable Prepaid Expenses and Other Assets Income Tax Receivable Accounts Payable and Accrued Expenses Accrued Litigation Expense Customer Deposits and Advance Payments 1.162,703) 466,799 (18,528) (9.263) (22.379) (4,635) (41,720) Cash Provided by Operating Activities INVESTING ACTIVITIES: Purchase of Investments Proceeds from Maturities and Calls of Investments Additions to Property. Plant and Equipment Acquisitions of Businesses and Contracts Proceeds from Dispositions of Businesses and Contracts Proceeds from Sale of Property, Plant, and Equipment (91,000) 102.118 (65,073) (30,799) 1.999 6,790 (75.965) Cash Used by Investing Activities
