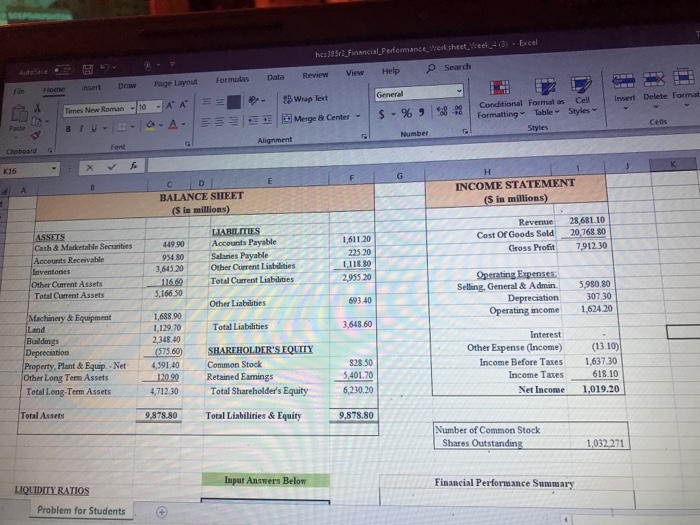
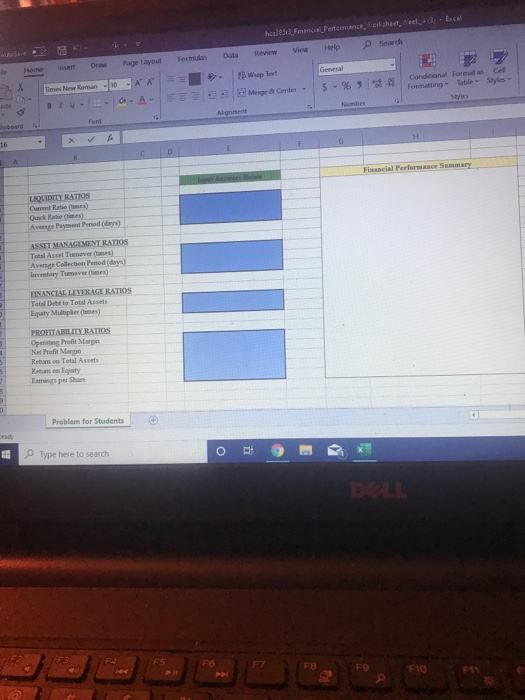
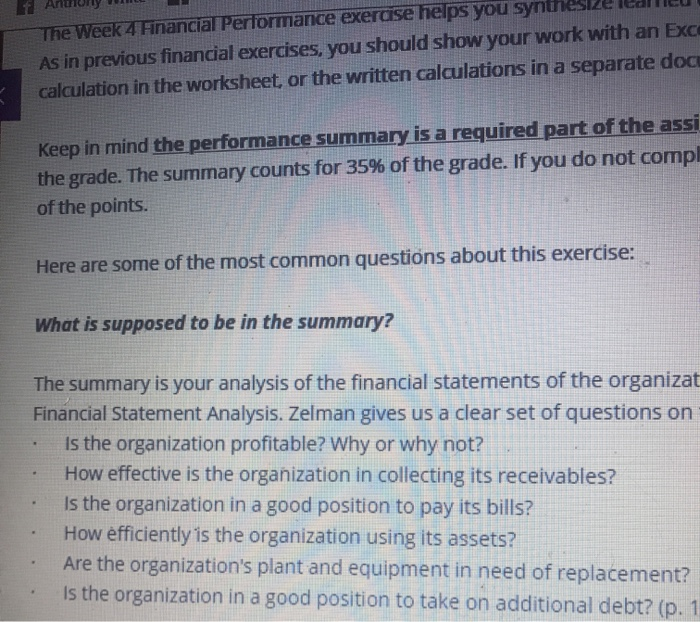
hes:3953 Financial Performance Worksheet_week_403) - Excel Review View Help Search Data de Insert Delete Format Home Insert Draw P age Layout Formulas Times New Roman - 10 XA = ELUL O-A.EE E Wrap Text Merge Center is. % 968 Conditional Formatas Formatting Table Styles Cell Styles Number Alignment Clipboard K16 - TFG col BALANCE SHEET (S in millions) INCOME STATEMENT (s in millions) Revenue Cost Of Goods Sold Gross Profit 28 681.10 20,768.80 7912.30 ASSETS Cash & Marketable Securities Accounts Receivable Inventories Other Current Assets Total Current Assets 449.90 954.80 3,645.20 116.00 3,166.50 LIABILITIES Accounts Payable Salaries Payable Other Current Liabilities Total Current Liabilities 1,611.20 225 20 1118.80 2955 20 Operating Expenses: Selling General & Admin. Depreciation Operating income 5,980.80 307.30 1,624.20 693.40 Other Liabilities Total Liabilities 3,648.60 Machinery & Equipment Land Buildings Depreciation Property, Plant & Equip. - Net Other Long Term Assets Total Long-Term Assets 1,688.90 1129.70 2,348.40 (575.60) 4,591.40 120.90 4,712.30 SHAREHOLDER'S EQUITY Common Stock Retained Eamings Retained amin Total Shareholder's Equity 828.50 5,401.70 Interest Other Expense (Income) Income Before Taxes Income Taxes Net Income (13.10) 1,63730 618.10 1,019.20 6,230.20 Total Assets 9.878.80 Total Liabilities & Equity 9.878.80 Number of Common Stock Shares Outstanding 1,032,271 Input Answers Below Financial Performance Summary LIQLIDITY RATIOS Problem for Students sheet 3 Excel 333 Financial Performance Search View Help Rev Data Formulas Page Layout Drew Home Insert General Wap Best Merge Center - mes New Roman - 10-AA 5 - % Condizional Formatos Cell Formatting - Table - Styles SA BIU- LIQUIDITY RATIOS Current Ratio ) Qack ( es) Ave Pay Peod (days) ASSET MANAGEMENT RATIOS Total Asut Tumeveres) Avenge Collection Perod (days) lovestory Tumeveres) FINANCIAL LEVERAGE RATIOS Tatal Debt to Total Assets Equaly Mulheres) PROLTTARILITY RATIOS Operating Profit Me Net Profit Martin Resume Total Assets Retumn Equity Em per Share Problem for Students Type here to search + Anury w The Week 4 Financial Performance exercise helps you synthesize talle As in previous financial exercises, you should show your work with an Exc calculation in the worksheet, or the written calculations in a separate doc Keep in mind the performance summary is a required part of the assi the grade. The summary counts for 35% of the grade. If you do not compl of the points. Here are some of the most common questions about this exercise: What is supposed to be in the summary? The summary is your analysis of the financial statements of the organizat Financial Statement Analysis. Zelman gives us a clear set of questions on Is the organization profitable? Why or why not? How effective is the organization in collecting its receivables? Is the organization in a good position to pay its bills? How efficiently is the organization using its assets? Are the organization's plant and equipment in need of replacement? . is the organization in a good position to take on additional debt? (p. 1