Answered step by step
Verified Expert Solution
Question
1 Approved Answer
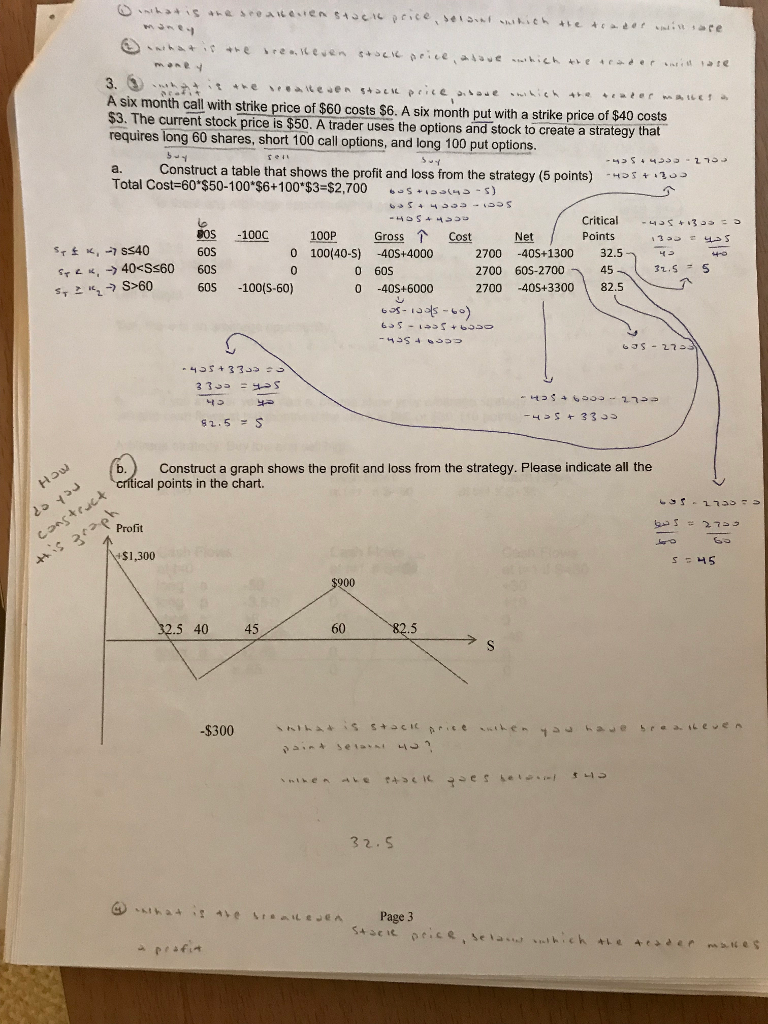
Hey Chegg, I need help with part B. I understand the critical points, but I don't understand where the +$1,300, -$300, & $900 came from

Hey Chegg, I need help with part B. I understand the critical points, but I don't understand where the +$1,300, -$300, & $900 came from in the graph. Please explain or show work to help me understand where those numbers came from. It would help a lot.
A six month call with strike price of $60 costs $6. A six month put with a strike price of $40 costs $3. The current stock price is $50. A trader uses the options and stock to create a strategy that requires long 60 shares, short 100 call options, and long 100 put options. a. Construct a table that shows the profit and loss from the strategy (5 points) os Total Cost-60 $50-100 $6+100 $3-$2,700 s -s) Critical S 3.. ios-100C 100p GrossCost Net / Points-,, 425 60S - -42 2700 -40S+1300 32.5 2700 60S-27004531.S 5 2700-40%3300182.5 40 0 100(40-S) -40S+4000 0 0 60s 0 -40S+6000 0 40S+6000 s,2":S-60 60S -100(5-60) 1.5 S Construct a graph shows the profit and loss from the strategy. Please indicate all the ical points in the chart. (b. ) Profit $1,300 2.5 40 45 60 .5 32.S
Step by Step Solution
There are 3 Steps involved in it
Step: 1

Get Instant Access to Expert-Tailored Solutions
See step-by-step solutions with expert insights and AI powered tools for academic success
Step: 2

Step: 3

Ace Your Homework with AI
Get the answers you need in no time with our AI-driven, step-by-step assistance
Get Started


