Answered step by step
Verified Expert Solution
Link Copied!

Question

1 Approved Answer

Hey how do I fix the error in this R studio code? the object 'pts' should be recognized bc i ran the require(tidyverse) with the

Hey how do I fix the error in this R studio code? the object 'pts' should be recognized bc i ran the require(tidyverse) with the data I need and it works for everything else. image text in transcribed

\#\# Question 1 [1 point] How points, on average, did the Boston Celtics score at home and away games in the 2017 season? Calculate this answer and also plot the multivariate relationship. Explain why your chosen visualization is justified. EC: Draw two vertical lines for the average points at home and away and label them with the average points using 'annotate(geom = 'text', ...)'. {r} games \%>\% filter (yearSeason == '2017', nameTeam == 'Boston Celtics') \% >% \# Filter to the 2017 season (yearSeason) AND to the Boston Celtics (nameTeam) group_by(locationGame) \%>\% \# Group by the location of the game (locatoinGame) summarise(mean_pts=mean(pts)) \#Calculate the average points (pts) games \%>\% filter (yearSeason == '2017', nameTeam == 'Boston Celtics') \%>\% \# Filter to the 2017 season (yearSeason) AND to the Boston Celtics (nameTeam) ggplot(aes(x=pts,fill= locationGame ))+ \# Create a multivariate plot comparing points scored betweer home and away games geom_density (alpha=0.3) + \# Choose the appropriate geom_... for this plot (i.e., geom_histogram(), geom_density(), geom_bar(), etc.) labs(title = "Points Scored by the Boston Celtics in 2017", subtitle = "Comparing Home and Away Games", x= "Location of Game", y= "Points Scored") + \# Add clear descriptions for the title, subtitle, axes, and legend geom_vline (aes(x=mean(pts[ locationGame == "Home"])), color = 'blue', linetype = 'dashed') + annotate("text", x=mean( pts[locationGame == "Home"]), y=0, vjust =1, hjust =0.2, size =4 ) + geom_vline(aes(xintercept = mean(pts[locationGame = "Away"])), color = 'red', linetype = 'dashed')+ annotate ("text", x= mean(pts[locationGame == "Away"]), y=0, vjust =1, hjust =1.2, size =4 )

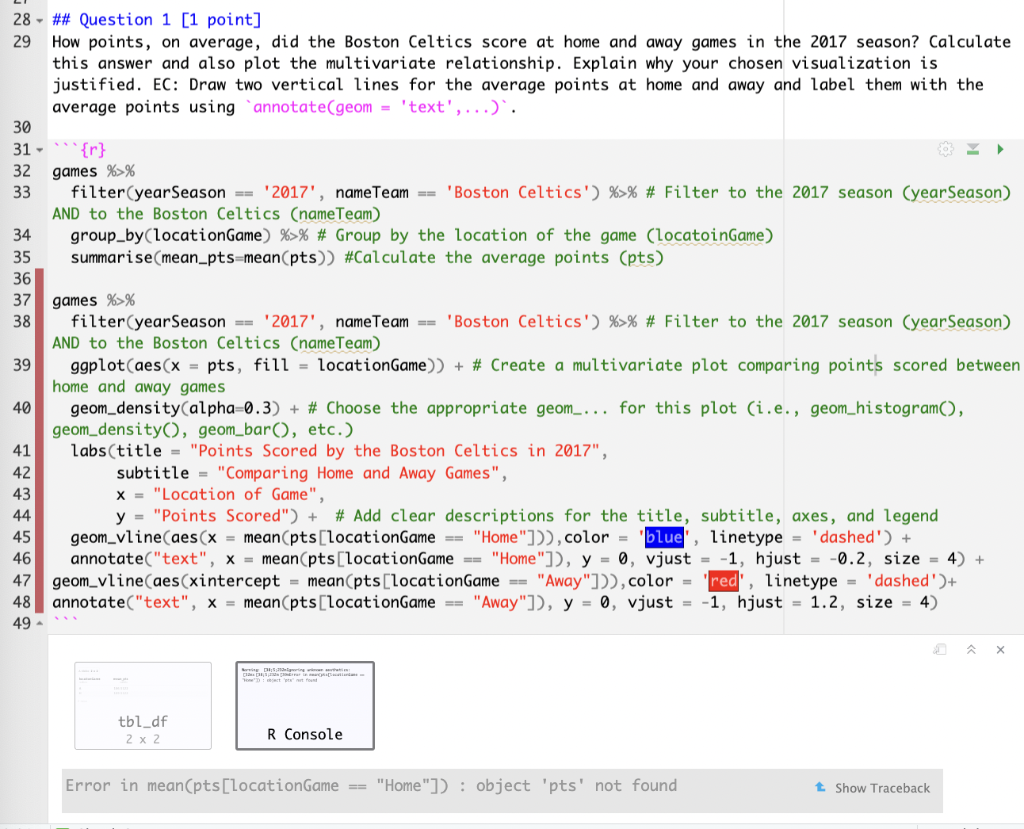
Step by Step Solution

There are 3 Steps involved in it

Step: 1

blur-text-image

Get Instant Access to Expert-Tailored Solutions

See step-by-step solutions with expert insights and AI powered tools for academic success

Step: 2

blur-text-image

Step: 3

blur-text-image

Ace Your Homework with AI

Get the answers you need in no time with our AI-driven, step-by-step assistance

Get Started

Recommended Textbook for

Oracle 10g Database Administrator Implementation And Administration

Authors: Gavin Powell, Carol McCullough Dieter

2nd Edition

1418836656, 9781418836658

More Books

Students also viewed these Databases questions