hey i need help with this
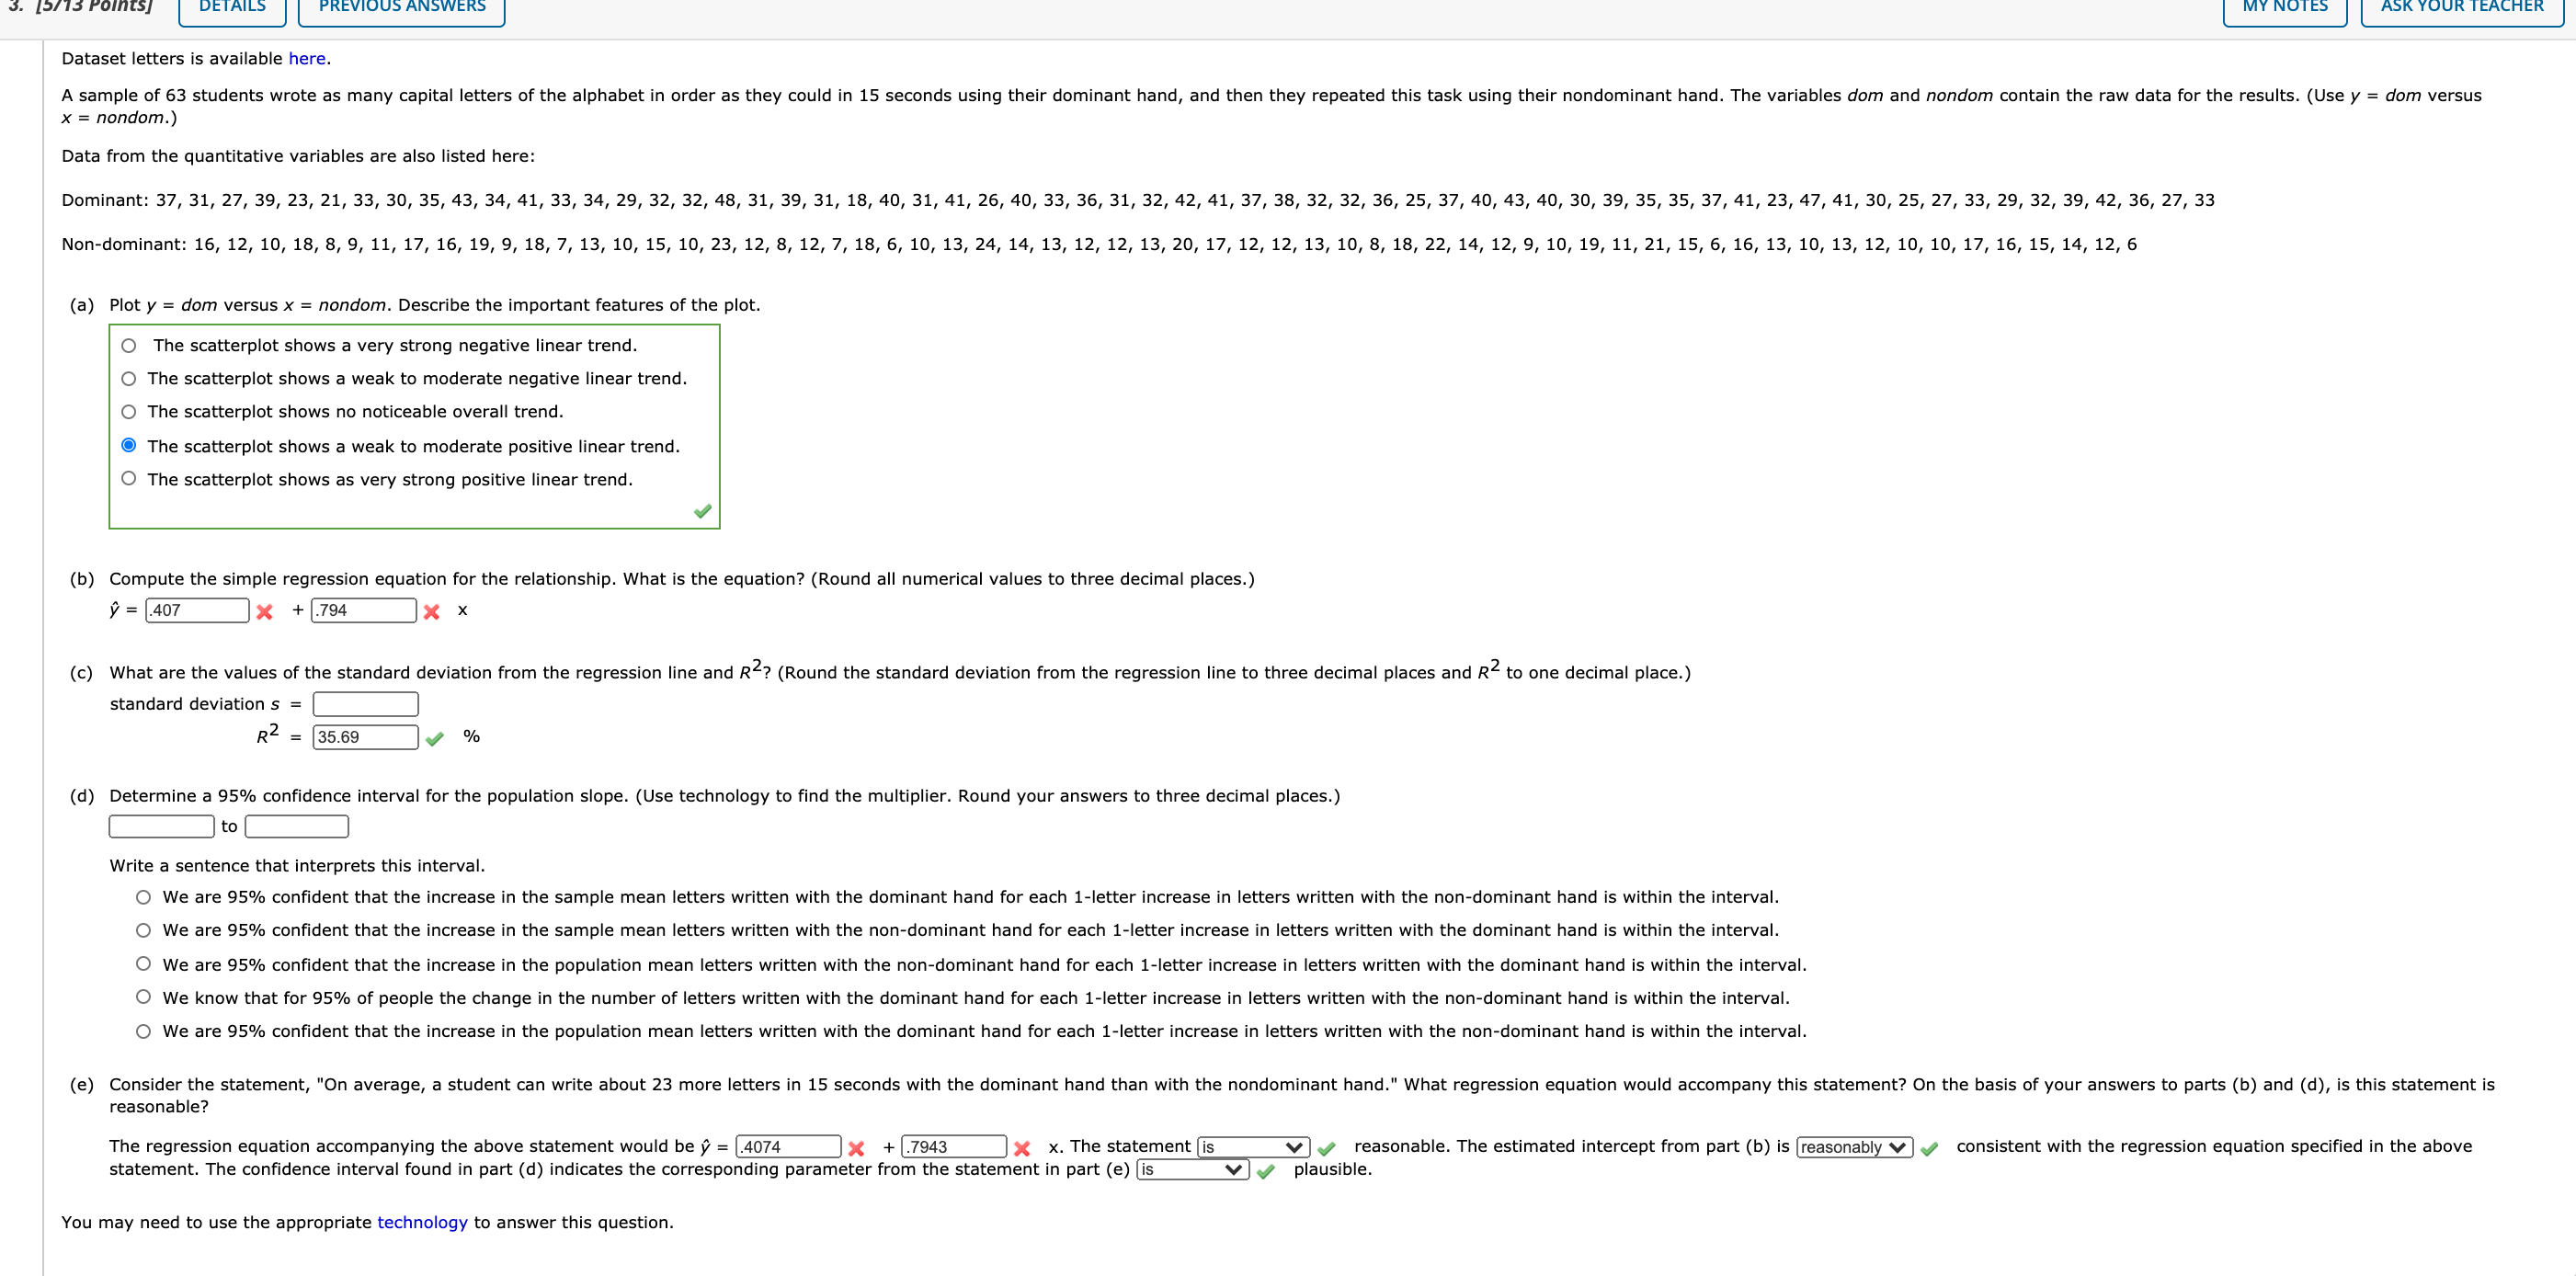
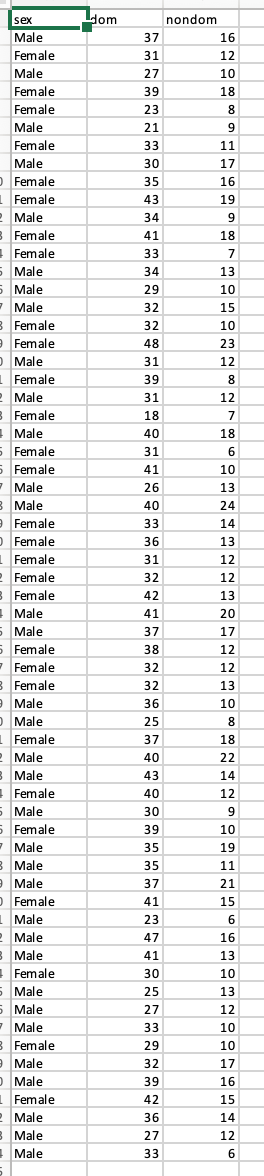
3. [ans PDlnB] DETAILS PREVIOUS ANSWERS Mv NOTES ASK VOUR TEACHER Dataset letters is available here. A sample of 63 students wrote as many capital letters of the alphabet in order as they could in 15 seconds using their dominant hand, and then they repeated this task using their nondominant hand. The variables dam and nondon-l contain the raw data for the results. (Use y = don-l versus x = nondom.) Data from the quantitative variables are also ed here: Dominant: 37, 31, 27, 39, 23, 21, 33, 30, 35, 43, 34, 41, 33, 34, 19, 32, 32, 48, 31, 39, 31, 18, 40, 31. 41, 26, 40, 33, 36, 31. 32, 42, 41, 37, 38, 32, 32, 36, 25, 37, 40, 43, 40, 30, 39, 35, 35, 37, 41, 23, 47, 41. 3D, 15, 27. 33, 29, 32, 39, 41, 36, 27, 33 Non-dominant: 1s, 12, 1o, 13, a, 9, 11, 17, 16, 19, 9, 1a, 7, 1:, 1o, 15, 1o, 23, 11,8, 12,7, 13, 6, 1o, 13, 24, 14, 13, 12, 12, 1:, 20, 17, 12, 12, :3, 10, a, 1d, 22, 14, 12, 9, 1o, 19, 11, 21, 1s, 6, 16, 13, 1o, 13, 12, 10, 1o, 17, 16, 1s, 14, 12, 5 (a) Plot y e dam versus x = nondom, Describe the important features of the pIoL o The scatterplot shows a very strong negative linear trend. 0 The scatterplot shows a weak to moderate negative linear trend. 0 The snatterplot shows no noticeable overall trend. 0 The scatterplot shows a weak to moderate positive linear trend. 0 The scatterplot shows as very strong positive linear trend. (b) Compute the simple regression equation fertile relationship. what is the equation? (Round all numerical values to three decimal places.) 9 = .401 x + .194 x x (c) What are the values of the standard deviation from the regression line and R2? (Round the standard deviation from the regression line to three decimal places and R2 to one decimal place) standard deviation 5 = R2 = 3569 % (d) Determine a 95% condence interval for the population slope. (Use technology to nd the multiplier. Round your answers to three decimal places.) to Write a sentence that interprets this interval. 0 We are 95% condent that the increase in the sample mean letters written wlth the dominant hand for each lletter increase in letters written with the non-dominant hand is within the interval. 0 We are 95% condent that the increase in the sample mean letters written with the non-dominant hand for each l-letter increase in letters written with the dominant hand is within the interval. 0 we are 95% condent that the increase in the population mean letters written with the non-dominant hand for each 1-Ietterlncrease in letters written with the dominant hand Is within the Interval. 0 We know that for 95% of people the change In the number of letters written with the dominant hand for each 1-letter increase in letters written with the non-dominant hand is within the interval. 0 We are 95% condent that the increase in the population mean letters written with the dominant hand for each 1-letter increase in letters written with the non-dominant hand is within the interval. (e) consider the statement, "on average, a student can write about 23 more letters in 15 seconds wlth the dominant hand than with the nondomlnant hand," what regression equation would accompany this statement? on the basis or your answers to pans (b) and (d), is this statement is reasonable? The regression equation accompanying the above statement would be p = .4074 x + x x. The statement reasonable. The estimated intercept from part (b) is reasonably v consistent with the regression equation specied in the above statement. The condence interval found in part (11) indicates the corresponding parameter from the statement in part (e) a v v plausible. Vou may need to use the appropriate technology to answer this question. sex Hom nondom Male 37 16 Female 31 12 Male 27 10 Female 39 18 Female 23 8 Male 21 9 Female 33 11 Male 30 17 Female 35 16 Female 43 19 Male 34 9 Female 41 18 Female 33 7 Male 34 13 Male 29 10 Male 32 15 Female 32 10 Female 48 23 Male 31 12 Female 39 8 Male 31 12 Female 18 7 Male 40 18 Female 31 6 Female 41 10 Male 26 13 Male 40 24 Female 33 14 Female 36 13 Female 31 12 Female 32 12 Female 42 13 Male 41 20 Male 37 17 Female 38 12 Female 32 12 Female 32 13 Male 36 10 Male 25 8 Female 37 18 Male 40 22 Male 43 14 Female 40 12 Male 30 9 Female 39 10 Male 35 19 Male 35 11 Male 37 21 Female 41 15 Male 23 6 Male 47 16 Male 41 13 Female 30 10 Male 25 13 Male 27 12 Male 33 10 Female 29 10 Male 32 17 Male 39 16 Female 42 15 Male 36 14 Male 27 12 Male 33 6