

Answered step by step
Verified Expert Solution
Question
1 Approved Answer
HEY NEED THIS URGENTLY CAN ANYONE PLEASE MAKE A SENSITIVITY ANALYSIS REPORT FOR THIS AND CAN ANYON ETELL ME HOW TO DO IT ASWELL IN
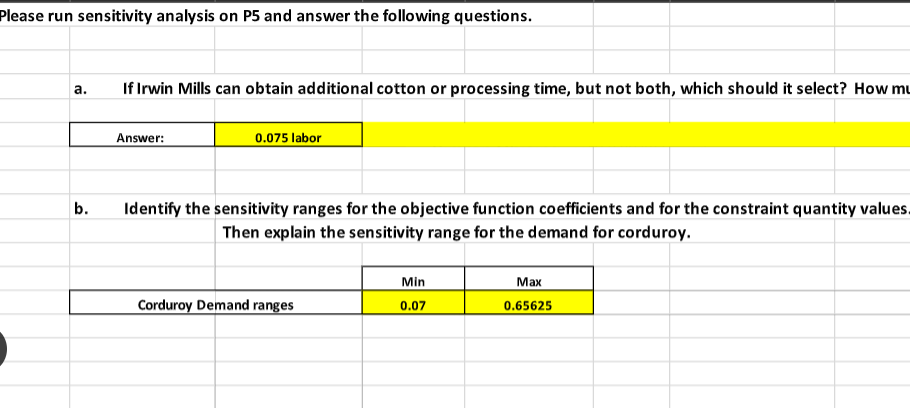
HEY NEED THIS URGENTLY CAN ANYONE PLEASE MAKE A SENSITIVITY ANALYSIS REPORT FOR THIS AND CAN ANYON ETELL ME HOW TO DO IT ASWELL IN STEPS.
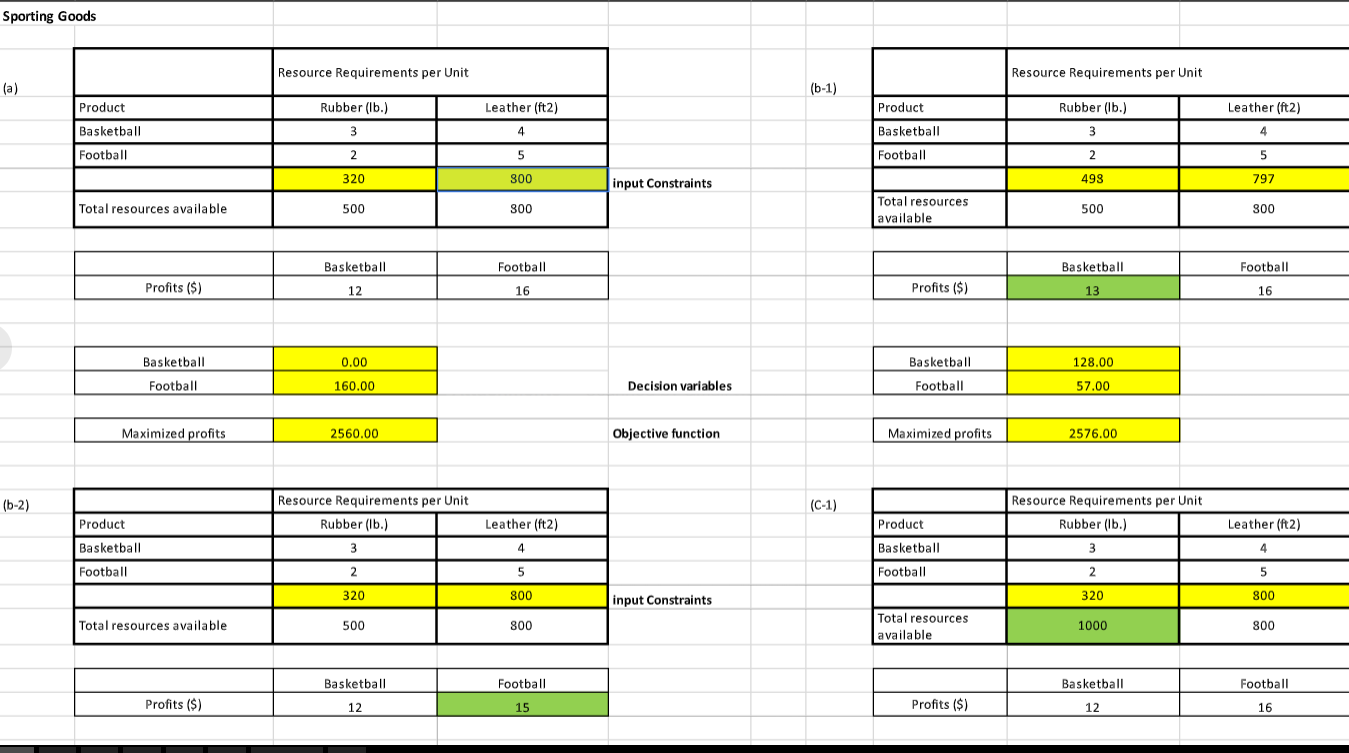
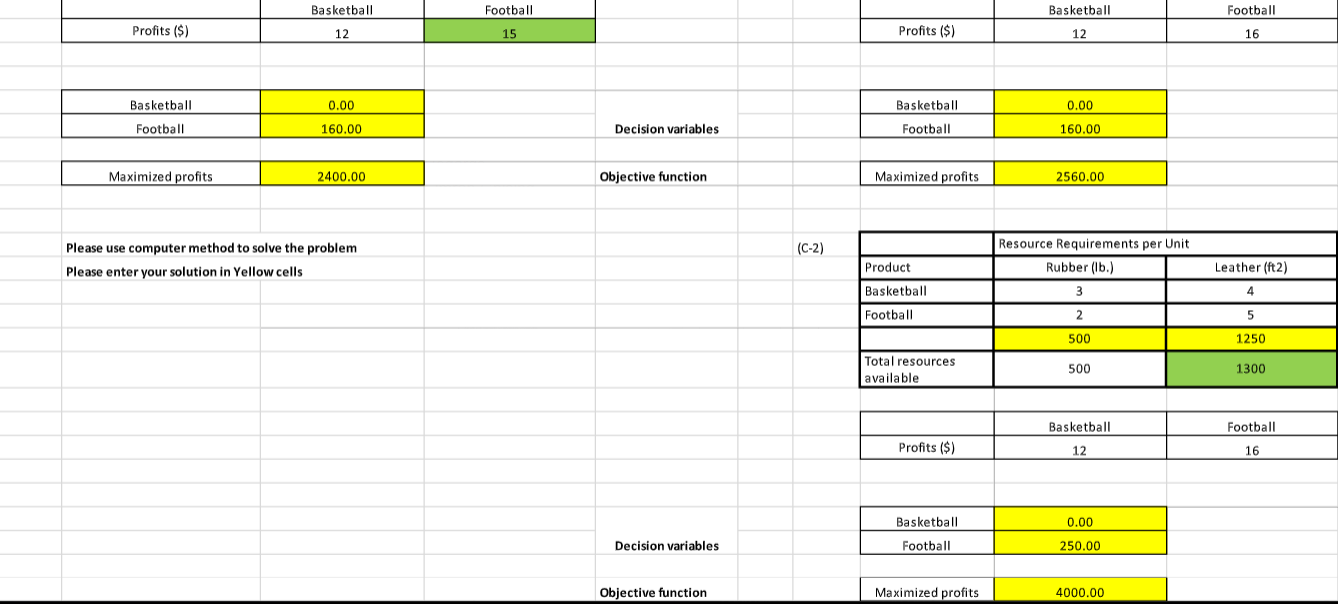
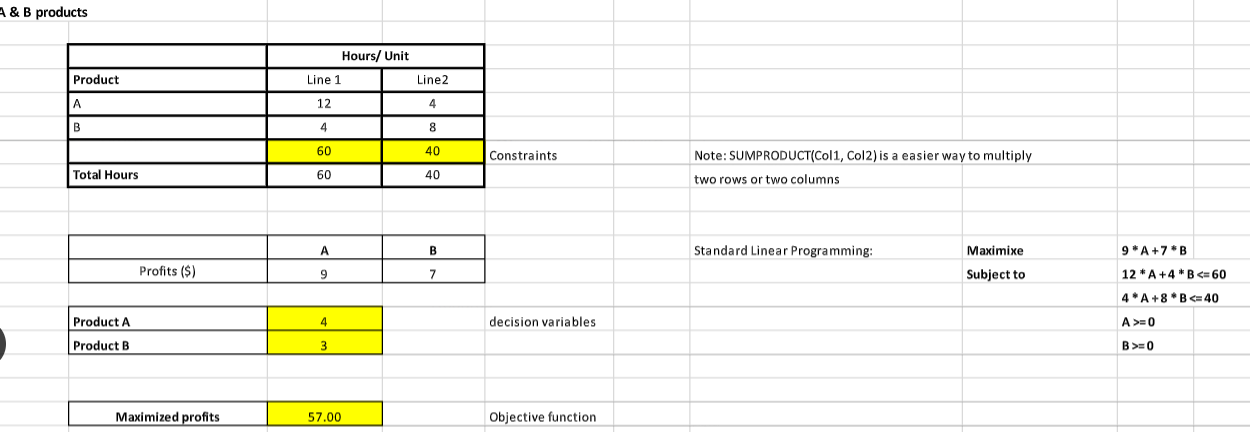
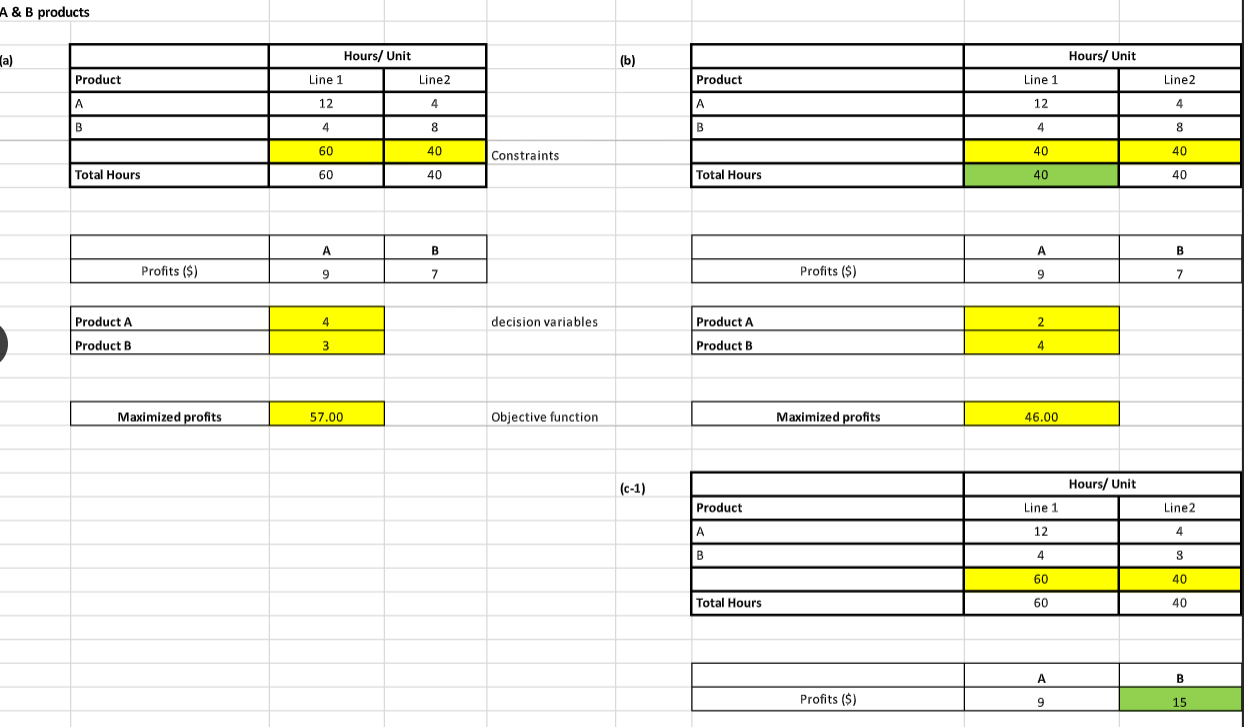
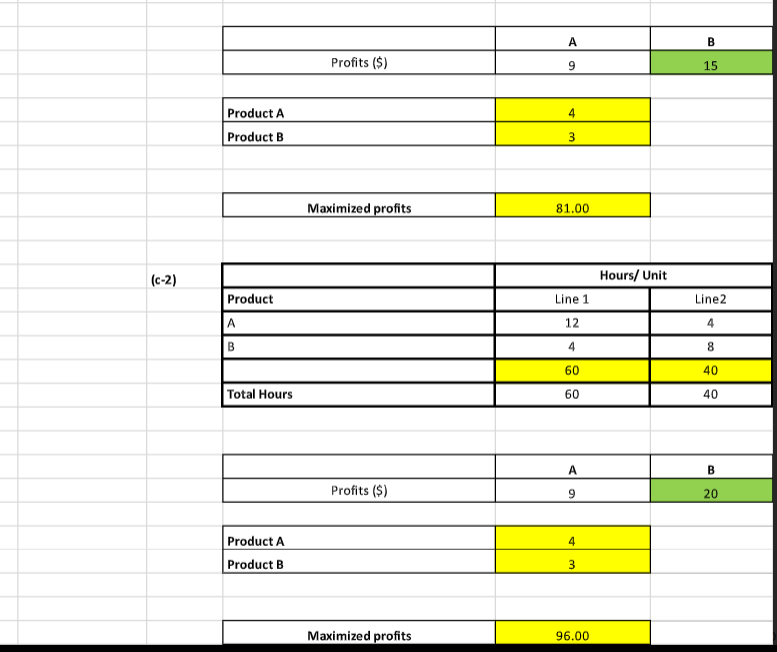
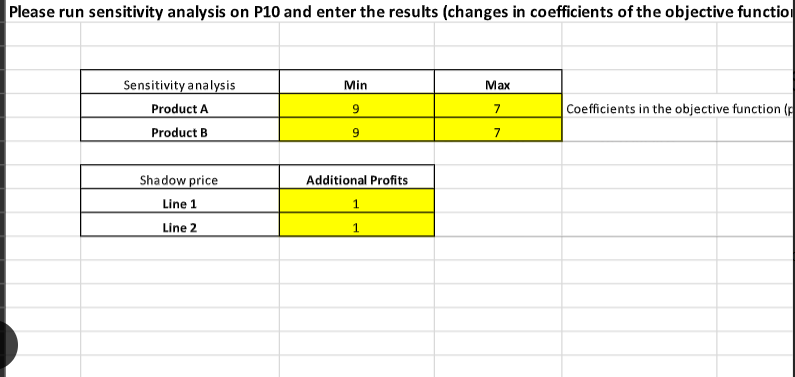
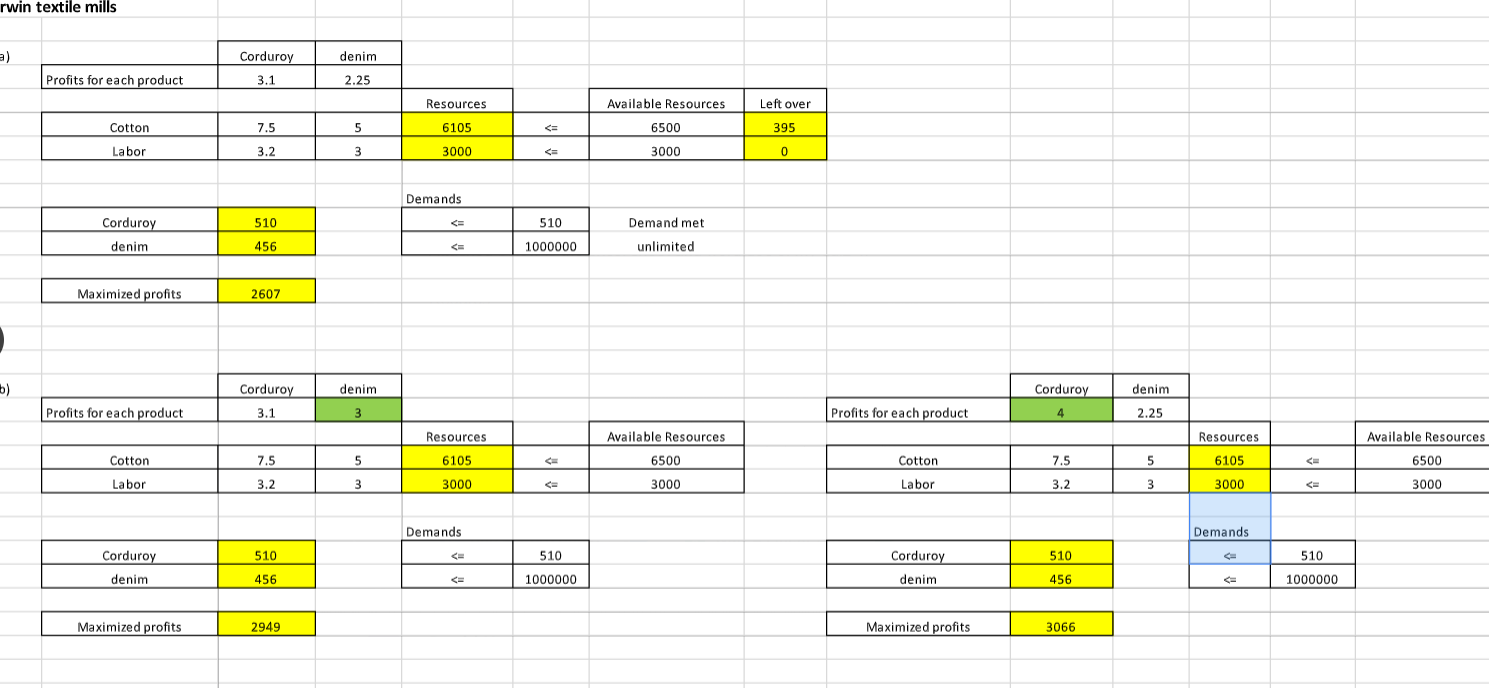
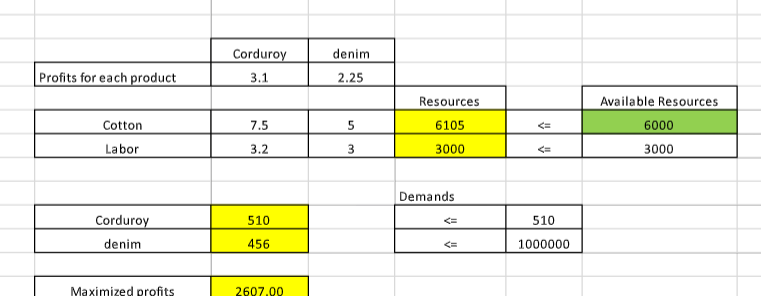
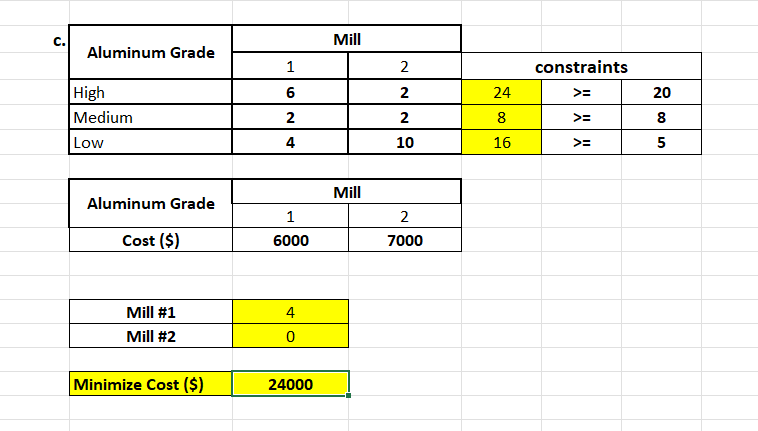
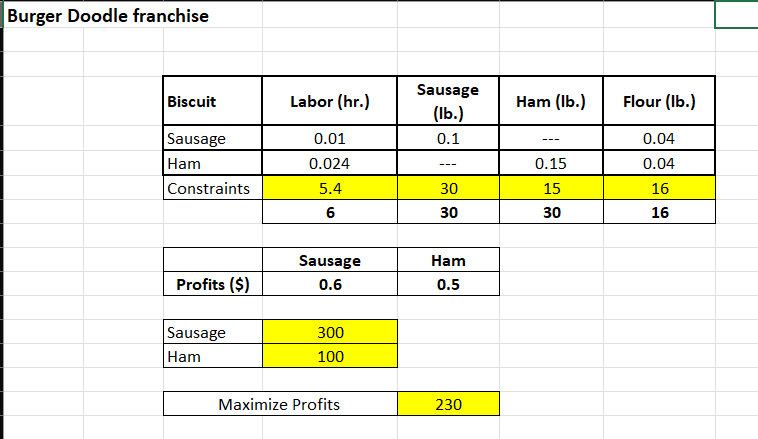
S A \& B products \begin{tabular}{|l|c|c|} \hline & \multicolumn{2}{|c|}{ Hours/ Unit } \\ \hline Product & Line 1 & Line2 \\ \hline A & 12 & 4 \\ \hline B & 4 & 8 \\ \hline & 60 & 40 \\ \hline Total Hours & 60 & 40 \\ \hline \end{tabular} \begin{tabular}{|c|c|c|} \hline & A & B \\ \hline Profits (\$) & 9 & 7 \\ \hline \end{tabular} Note: SUMPRODUCT(Col1, Col2) is a easier way to multiply two rows or two columns Standard Linear Programming: Maximixe Subject to 9A+7B 12A+4B=0 B>=0 A \& B products (a) \begin{tabular}{|l|c|c|} \hline & \multicolumn{2}{|c|}{ Hours/ Unit } \\ \hline Product & Line 1 & Line2 \\ \hline A & 12 & 4 \\ \hline B & 4 & 8 \\ \hline & 60 & 40 \\ \hline Total Hours & 60 & 40 \\ \hline \end{tabular} \begin{tabular}{|c|c|c|} \hline & A & B \\ \hline Profits (\$) & 9 & 7 \\ \hline \end{tabular} (b) \begin{tabular}{|l|c|c|} \hline & \multicolumn{2}{|c|}{ Hours/ Unit } \\ \hline Product & Line 1 & Line2 \\ \hline A & 12 & 4 \\ \hline B & 4 & 8 \\ \hline & 40 & 40 \\ \hline Total Hours & 40 & 40 \\ \hline \end{tabular} \begin{tabular}{|c|c|c|} \hline & A & B \\ \hline Profits ($) & 9 & 7 \\ \hline \end{tabular} \begin{tabular}{|l|c|} \hline Product A & 2 \\ \hline Product B & 4 \\ \hline & \\ \hline Maximized profits & \\ \hline \end{tabular} (c-1) \begin{tabular}{|l|c|c|} \hline & \multicolumn{2}{|c|}{ Hours/ Unit } \\ \hline Product & Line 1 & Line2 \\ \hline A & 12 & 4 \\ \hline B & 4 & 3 \\ \hline & 60 & 40 \\ \hline Total Hours & 60 & 40 \\ \hline \end{tabular} \begin{tabular}{|c|c|c|} \hline & A & B \\ \hline Profits ($) & 9 & 15 \\ \hline \end{tabular} \begin{tabular}{|c|c|c|} \hline & A & B \\ \hline Profits (\$) & 9 & 15 \\ \hline \end{tabular} \begin{tabular}{|l|c|} \hline Product A & 4 \\ \hline Product B & 3 \\ \hline \end{tabular} (c-2) \begin{tabular}{|l|c|} \hline Product A & 4 \\ \hline Product B & 3 \\ \hline \end{tabular} Maximized profits 96.00 Please run sensitivity analysis on P10 and enter the results (changes in coefficients of the objective functio rwin textile mills b. Identify the sensitivity ranges for the objective function coefficients and for the constraint quantity values Then explain the sensitivity range for the demand for corduroy. c. \begin{tabular}{|l|c|c|c|c|c|} \hline \multirow{2}{*}{ Aluminum Grade } & \multicolumn{3}{|c|}{ Mill } & \multicolumn{2}{c|}{} \\ \cline { 2 - 5 } & 1 & 2 & \multicolumn{3}{|c|}{ constraints } \\ \hline High & 6 & 2 & 24 & >= & 20 \\ \hline Medium & 2 & 2 & 8 & >= & 8 \\ \hline Low & 4 & 10 & 16 & >= & 5 \\ \hline \end{tabular} \begin{tabular}{|c|c|c|} \hline \multirow{2}{*}{ Aluminum Grade } & \multicolumn{2}{|c|}{ Mill } \\ \cline { 2 - 3 } & 1 & 2 \\ \hline Cost ($) & 6000 & 7000 \\ \hline \end{tabular} \begin{tabular}{|l|l|} \hline Mill \#1 & 4 \\ \hline Mill \#2 & 0 \\ \hline \end{tabular} \begin{tabular}{|l|l|} \hline Minimize Cost (\$) & 24000 \\ \hline \end{tabular} Burger Doodle franchise \begin{tabular}{|c|c|c|} \hline & Sausage & Ham \\ \hline Profits (\$) & 0.6 & 0.5 \\ \hline \end{tabular} \begin{tabular}{|l|l|} \hline Sausage & 300 \\ \hline Ham & 100 \\ \hline \end{tabular} \begin{tabular}{|l|c|} \hline Maximize Profits & 230 \\ \hline \end{tabular} S A \& B products \begin{tabular}{|l|c|c|} \hline & \multicolumn{2}{|c|}{ Hours/ Unit } \\ \hline Product & Line 1 & Line2 \\ \hline A & 12 & 4 \\ \hline B & 4 & 8 \\ \hline & 60 & 40 \\ \hline Total Hours & 60 & 40 \\ \hline \end{tabular} \begin{tabular}{|c|c|c|} \hline & A & B \\ \hline Profits (\$) & 9 & 7 \\ \hline \end{tabular} Note: SUMPRODUCT(Col1, Col2) is a easier way to multiply two rows or two columns Standard Linear Programming: Maximixe Subject to 9A+7B 12A+4B=0 B>=0 A \& B products (a) \begin{tabular}{|l|c|c|} \hline & \multicolumn{2}{|c|}{ Hours/ Unit } \\ \hline Product & Line 1 & Line2 \\ \hline A & 12 & 4 \\ \hline B & 4 & 8 \\ \hline & 60 & 40 \\ \hline Total Hours & 60 & 40 \\ \hline \end{tabular} \begin{tabular}{|c|c|c|} \hline & A & B \\ \hline Profits (\$) & 9 & 7 \\ \hline \end{tabular} (b) \begin{tabular}{|l|c|c|} \hline & \multicolumn{2}{|c|}{ Hours/ Unit } \\ \hline Product & Line 1 & Line2 \\ \hline A & 12 & 4 \\ \hline B & 4 & 8 \\ \hline & 40 & 40 \\ \hline Total Hours & 40 & 40 \\ \hline \end{tabular} \begin{tabular}{|c|c|c|} \hline & A & B \\ \hline Profits ($) & 9 & 7 \\ \hline \end{tabular} \begin{tabular}{|l|c|} \hline Product A & 2 \\ \hline Product B & 4 \\ \hline & \\ \hline Maximized profits & \\ \hline \end{tabular} (c-1) \begin{tabular}{|l|c|c|} \hline & \multicolumn{2}{|c|}{ Hours/ Unit } \\ \hline Product & Line 1 & Line2 \\ \hline A & 12 & 4 \\ \hline B & 4 & 3 \\ \hline & 60 & 40 \\ \hline Total Hours & 60 & 40 \\ \hline \end{tabular} \begin{tabular}{|c|c|c|} \hline & A & B \\ \hline Profits ($) & 9 & 15 \\ \hline \end{tabular} \begin{tabular}{|c|c|c|} \hline & A & B \\ \hline Profits (\$) & 9 & 15 \\ \hline \end{tabular} \begin{tabular}{|l|c|} \hline Product A & 4 \\ \hline Product B & 3 \\ \hline \end{tabular} (c-2) \begin{tabular}{|l|c|} \hline Product A & 4 \\ \hline Product B & 3 \\ \hline \end{tabular} Maximized profits 96.00 Please run sensitivity analysis on P10 and enter the results (changes in coefficients of the objective functio rwin textile mills b. Identify the sensitivity ranges for the objective function coefficients and for the constraint quantity values Then explain the sensitivity range for the demand for corduroy. c. \begin{tabular}{|l|c|c|c|c|c|} \hline \multirow{2}{*}{ Aluminum Grade } & \multicolumn{3}{|c|}{ Mill } & \multicolumn{2}{c|}{} \\ \cline { 2 - 5 } & 1 & 2 & \multicolumn{3}{|c|}{ constraints } \\ \hline High & 6 & 2 & 24 & >= & 20 \\ \hline Medium & 2 & 2 & 8 & >= & 8 \\ \hline Low & 4 & 10 & 16 & >= & 5 \\ \hline \end{tabular} \begin{tabular}{|c|c|c|} \hline \multirow{2}{*}{ Aluminum Grade } & \multicolumn{2}{|c|}{ Mill } \\ \cline { 2 - 3 } & 1 & 2 \\ \hline Cost ($) & 6000 & 7000 \\ \hline \end{tabular} \begin{tabular}{|l|l|} \hline Mill \#1 & 4 \\ \hline Mill \#2 & 0 \\ \hline \end{tabular} \begin{tabular}{|l|l|} \hline Minimize Cost (\$) & 24000 \\ \hline \end{tabular} Burger Doodle franchise \begin{tabular}{|c|c|c|} \hline & Sausage & Ham \\ \hline Profits (\$) & 0.6 & 0.5 \\ \hline \end{tabular} \begin{tabular}{|l|l|} \hline Sausage & 300 \\ \hline Ham & 100 \\ \hline \end{tabular} \begin{tabular}{|l|c|} \hline Maximize Profits & 230 \\ \hline \end{tabular}Step by Step Solution
There are 3 Steps involved in it
Step: 1

Get Instant Access to Expert-Tailored Solutions
See step-by-step solutions with expert insights and AI powered tools for academic success
Step: 2

Step: 3
Ace Your Homework with AI
Get the answers you need in no time with our AI-driven, step-by-step assistance
Get Started
Managerial Accounting
Authors: Peter Clarke
2nd Edition
9781907214240