

Question
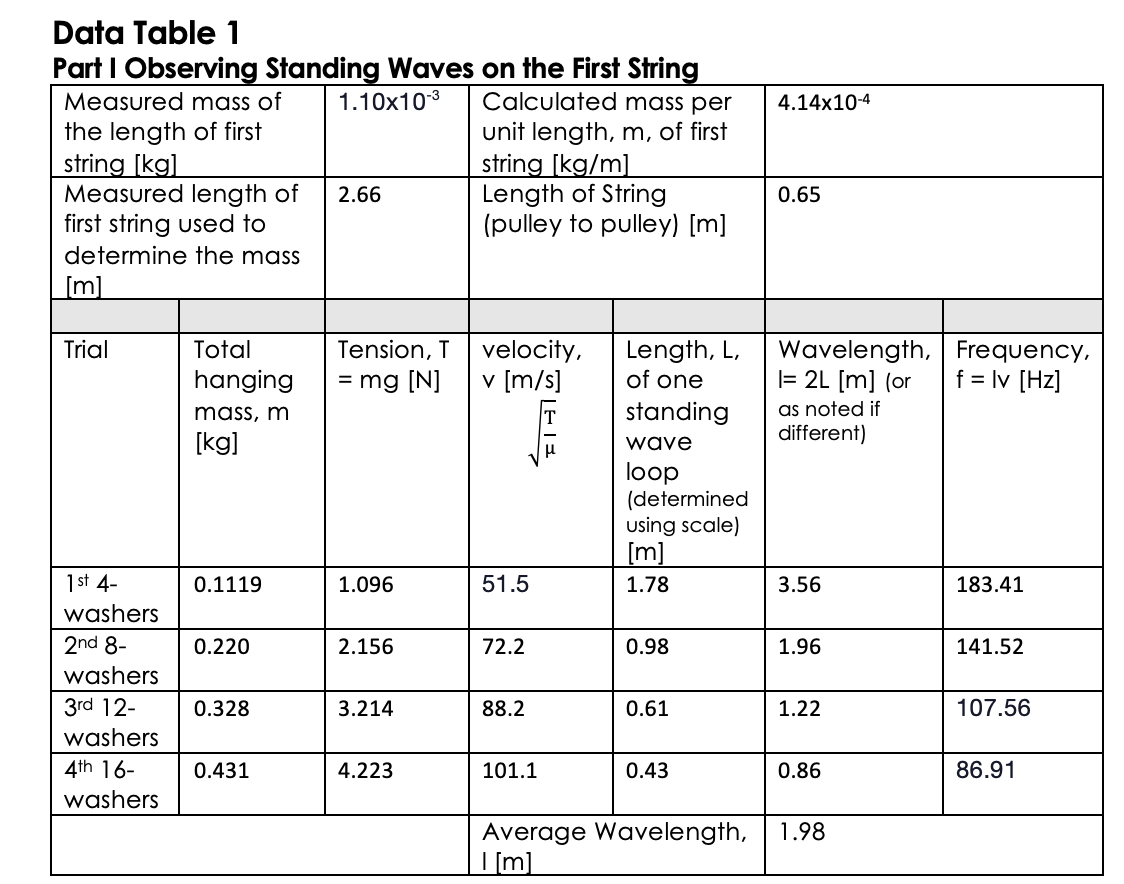
Hi, can I please get some help with these questions by looking at the data table? AND Make a graph for table 1 - velocity,
Hi, can I please get some help with these questions by looking at the data table? AND Make a graph for table 1
- velocity, v, vs frequency, f. {Note: variables are identified for graphing as y vs x} On the graph insert a best fit line and display the equation on the graph (title the graph, label the axis with quantity and units). Consider whether the data point (0, 0) should be included on your graph; include the point (0, 0) if it is in agreement with the experiment and relationships between the variables.
Step by Step Solution
There are 3 Steps involved in it
Step: 1

Get Instant Access to Expert-Tailored Solutions
See step-by-step solutions with expert insights and AI powered tools for academic success
Step: 2

Step: 3
Ace Your Homework with AI
Get the answers you need in no time with our AI-driven, step-by-step assistance
Get Started
Infrared Technology Fundamentals
Authors: Monroe Schlessinger
2nd Edition
1351438344, 9781351438346