hi, can you help me with these problems?
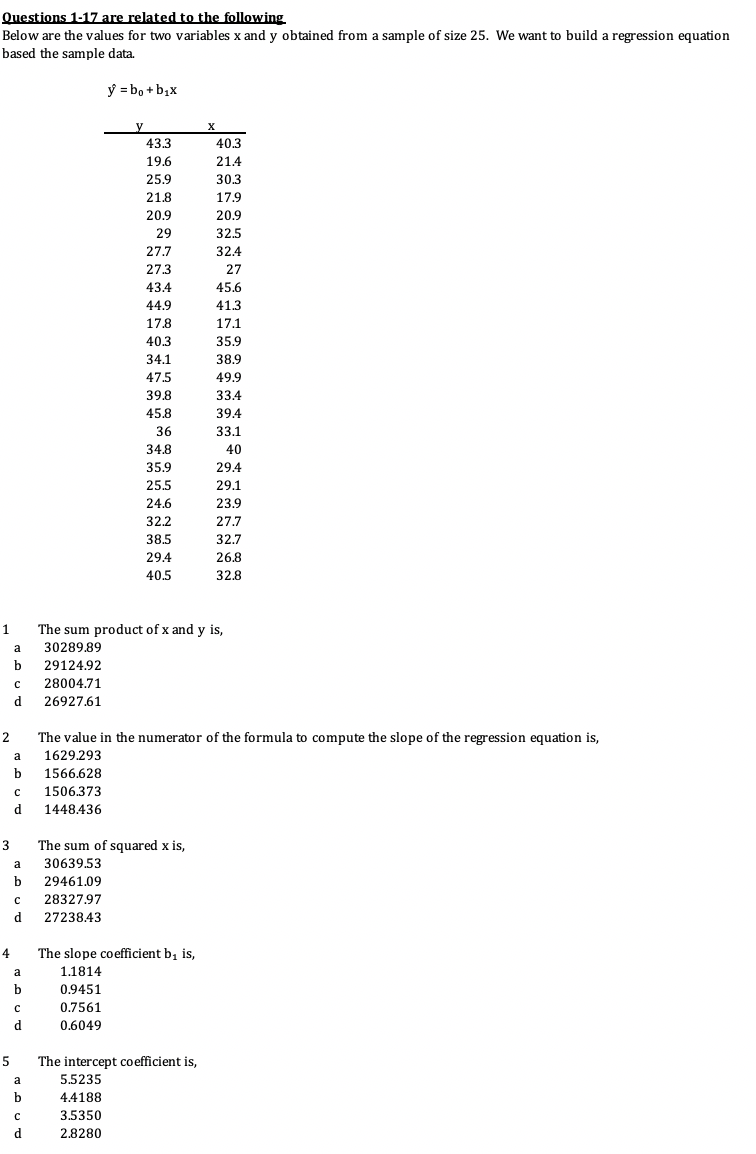
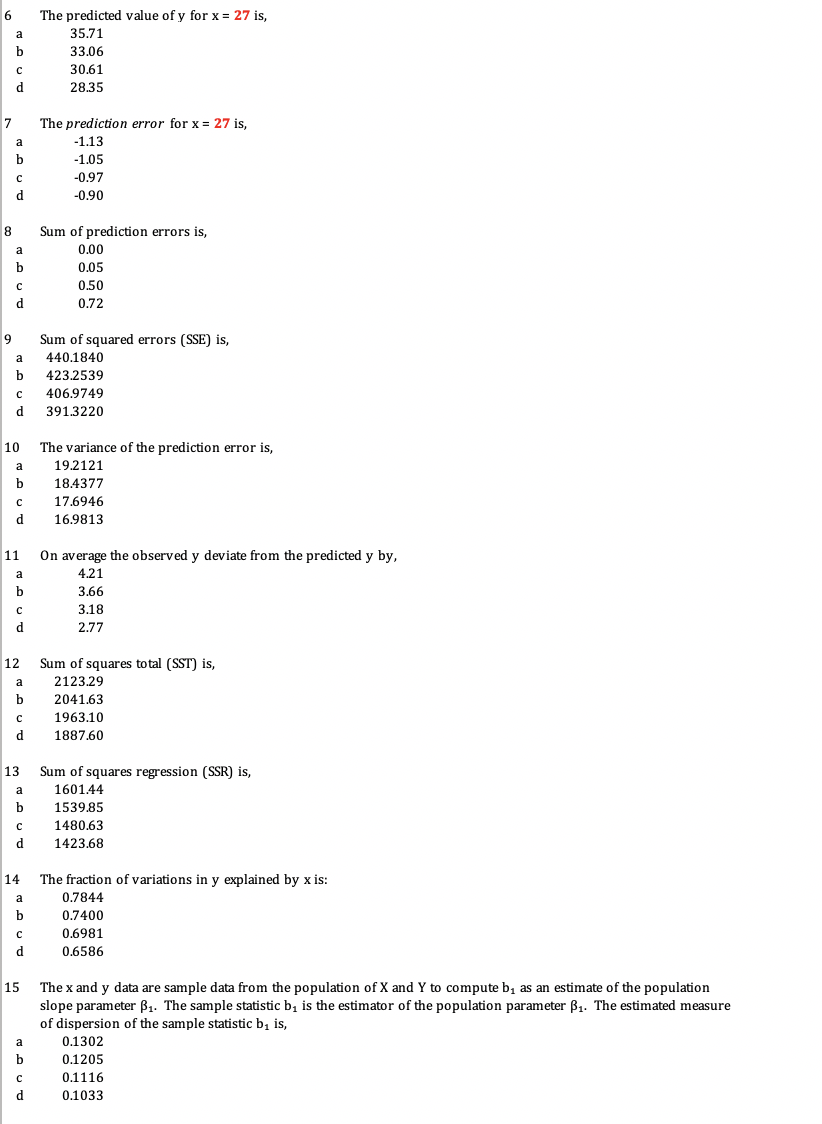
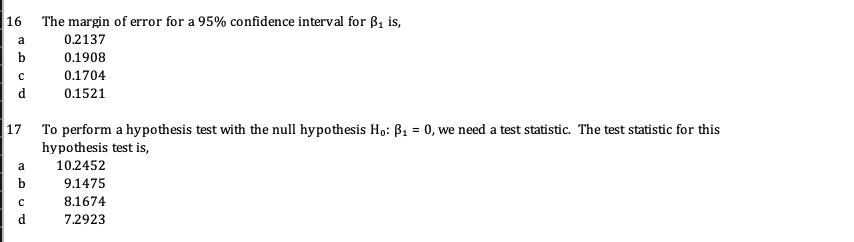
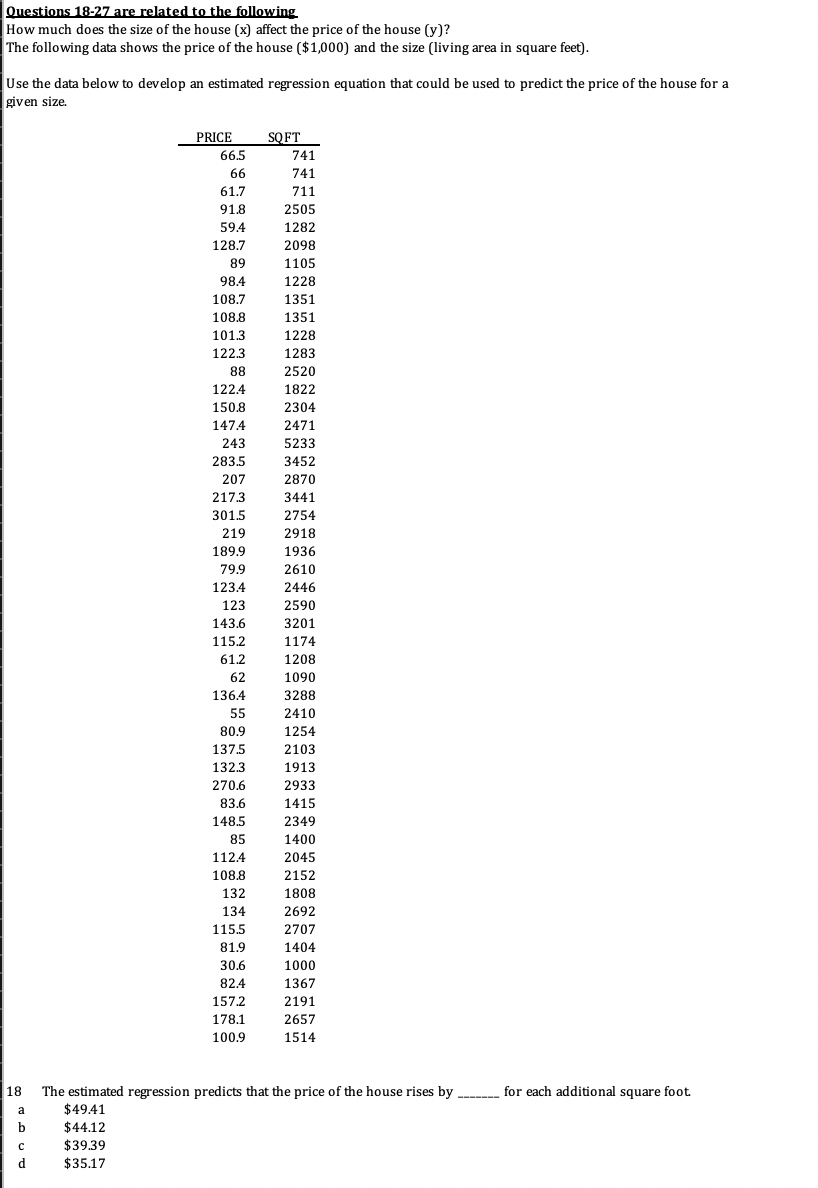
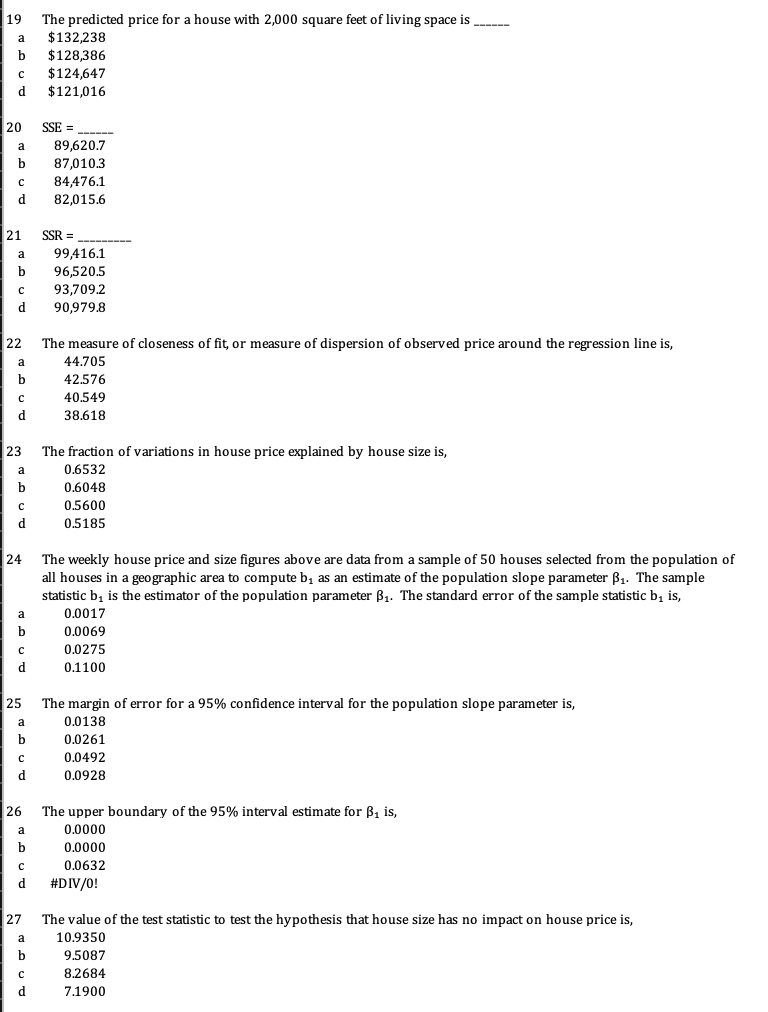
Questions 1-17 are related to the following Below are the values for two variables x and y obtained from a sample of size 25. We want to build a regression equation based the sample data. y = bo + bix 43.3 40.3 19.6 21.4 25.9 30.3 21.8 17.9 20.9 20.9 29 32.5 27.7 32.4 27.3 27 43.4 45.6 44.9 41.3 17.8 17.1 40.3 35.9 34.1 38.9 47.5 49.9 39.8 33.4 45.8 39.4 36 33.1 34.8 40 35.9 29.4 25.5 29.1 24.6 23.9 32.2 27.7 38.5 32.7 29.4 26.8 40.5 32.8 1 The sum product of x and y is, 30289.89 29124.92 28004.71 26927.61 The value in the numerator of the formula to compute the slope of the regression equation is, 1629.293 1566.628 1506.373 1448.436 The sum of squared x is, 30639.53 29461.09 28327.97 27238.43 The slope coefficient b, is, 1.1814 0.9451 0.7561 0.6049 The intercept coefficient is, 5.5235 4.4188 3.5350 2.82806 The predicted value of y for x = 27 is, 35.71 33.06 30.61 28.35 The prediction error for x = 27 is, -1.13 -1.05 -0.97 -0.90 Sum of prediction errors is, 0.00 0.05 0.50 0.72 Sum of squared errors (SSE) is, 440.1840 423.2539 406.9749 391.3220 10 The variance of the prediction error is, 19.2121 18.4377 17.6946 16.9813 11 On average the observed y deviate from the predicted y by, 4.21 3.66 3.18 2.7 12 Sum of squares total (SST) is, 2123.29 2041.63 1963.10 1887.60 13 Sum of squares regression (SSR) is, 1601.44 1539.85 1480.63 1423.68 14 The fraction of variations in y explained by x is: 0.7844 0.7400 0.6981 0.6586 15 The x and y data are sample data from the population of X and Y to compute b, as an estimate of the population slope parameter B1. The sample statistic b, is the estimator of the population parameter B1. The estimated measure of dispersion of the sample statistic b, is, 0.1302 0.1205 0.1116 0.103316 The margin of error for a 95% confidence interval for B, is, a 0.2137 b 0.1908 0.1704 0.1521 17 To perform a hypothesis test with the null hypothesis Ho: B, = 0, we need a test statistic. The test statistic for this hypothesis test is, a 10.2452 b 9.1475 C 8.1674 d 7.2923ll I' 1322 II II I] ll . How much dog the size of the house [x] affect the price of the house [3?]? The following data shows the price of the house [$1,000] and the size [living area in square feet]. Use the data below to develop an estimated regression equation that could he used to predict the price of the house for a given size PRICE FT 66.5 741 66 741 61.7 711 91.8 2505 59.4 1282 128.7 2098 89 1105 98.4 1228 108.7 1351 108.8 1351 101.3 1228 122.3 1283 88 2520 122.4 1822 150.8 2304 147.4 2471 243 5233 283.5 3452 207 2870 217.3 3441 301.5 2754 219 2918 189.9 1936 79.9 2610 123.4 2446 123 2590 143.6 3201 115.2 1174 61.2 1208 62 1090 136.4 3288 55 2410 80.9 1254 137.5 2103 132.3 1913 270.6 2933 83.6 1415 148.5 2349 85 1400 112.4 2045 108.8 2152 132 1808 134 2692 115.5 2707 81.9 1404 30.6 1000 82.4 1367 157.2 2191 178.1 2657 100.9 1514 18 The estimated regression predicts that the price of the house rises by _______ for each additional square foot. a $49.41 h $44.12 c $39.39 d $35.17 19 The predicted price for a house with 2,000 square feet of living space is $132,238 $128,386 $124,647 $121,016 20 SSE = 89,620.7 87,010.3 84,476.1 82,015.6 21 SSR = 99,416.1 96,520.5 93,709.2 90,979.8 22 The measure of closeness of fit, or measure of dispersion of observed price around the regression line is, 44.705 42.576 40.549 38.618 23 The fraction of variations in house price explained by house size is, 0.6532 0.6048 0.5600 0.5185 24 The weekly house price and size figures above are data from a sample of 50 houses selected from the population of all houses in a geographic area to compute b, as an estimate of the population slope parameter B1. The sample statistic b, is the estimator of the population parameter B1. The standard error of the sample statistic b, is, 0.0017 0.0069 0.0275 0.1100 25 The margin of error for a 95% confidence interval for the population slope parameter is, 0.0138 0.0261 0.0492 0.0928 26 The upper boundary of the 95% interval estimate for B, is, 0.0000 0.0000 0.0632 #DIV/0! 27 The value of the test statistic to test the hypothesis that house size has no impact on house price is, 10.9350 9.5087 8.2684 7.1900