Hi, can you help me with this? Please don't say "incomplete question" or "missing information" because it's not and there is no missing information. Thanks
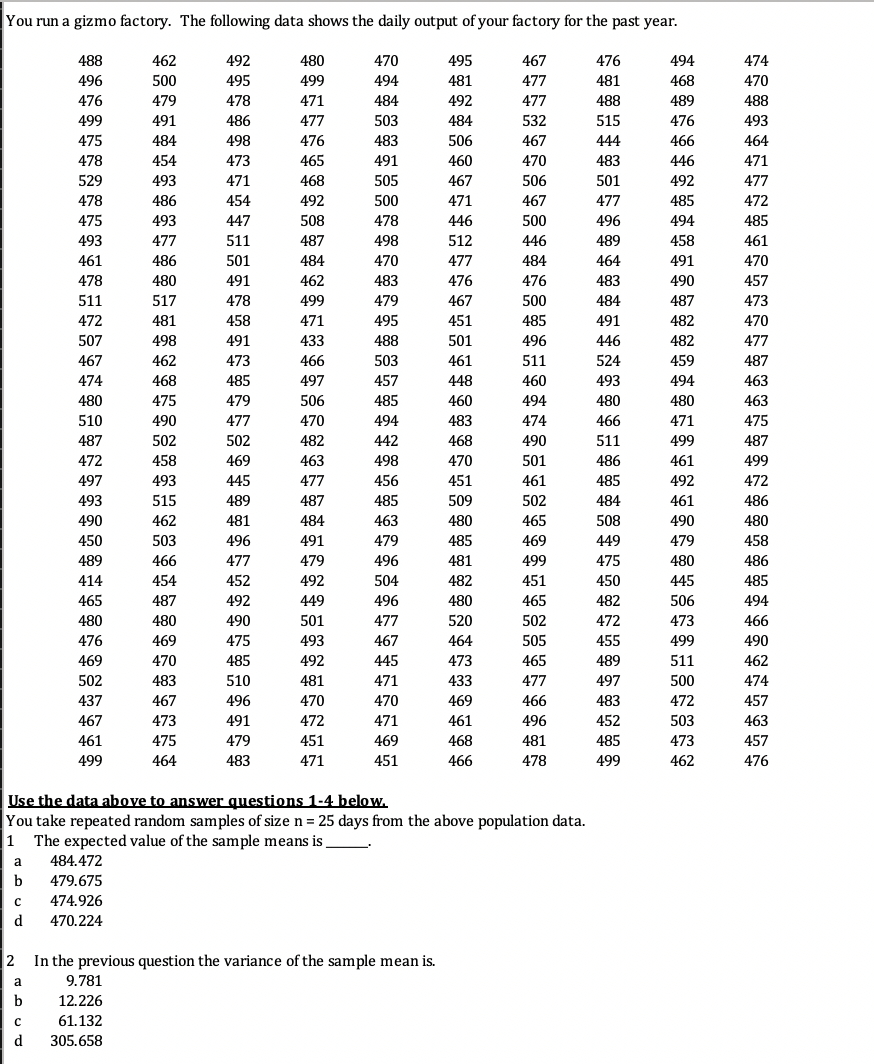
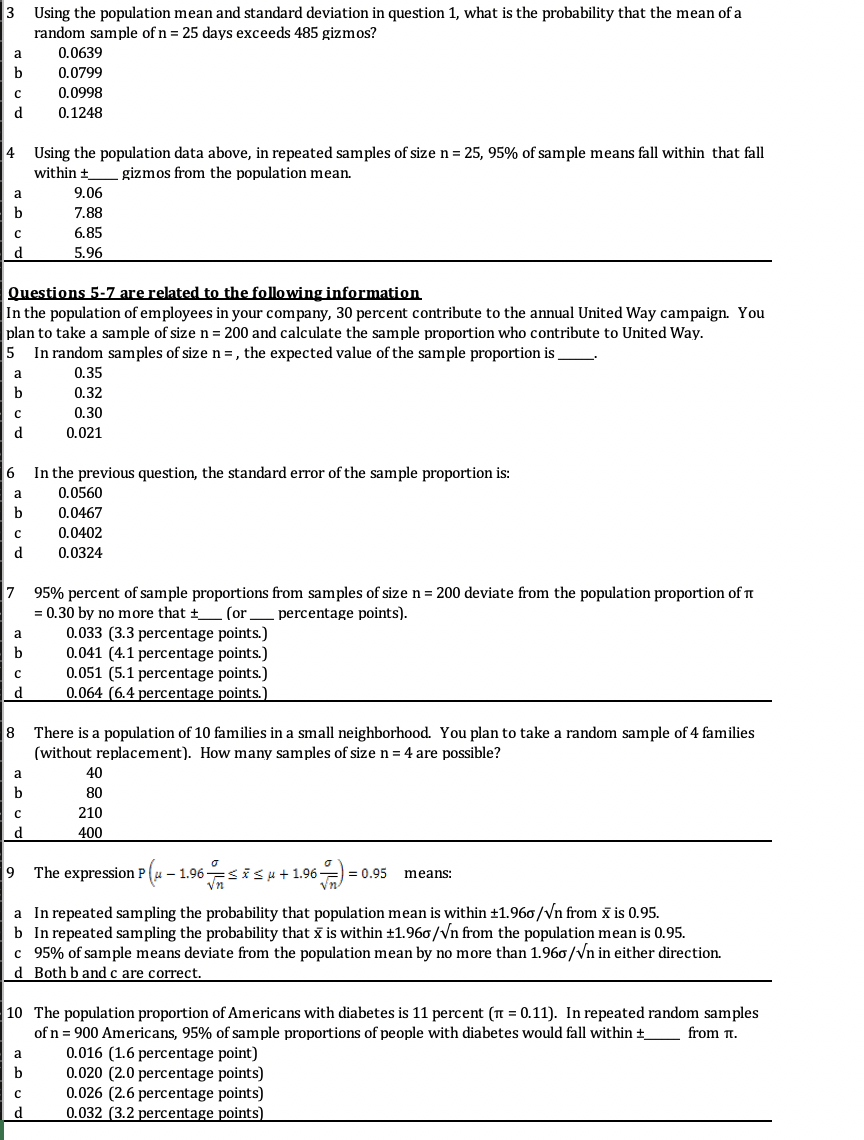
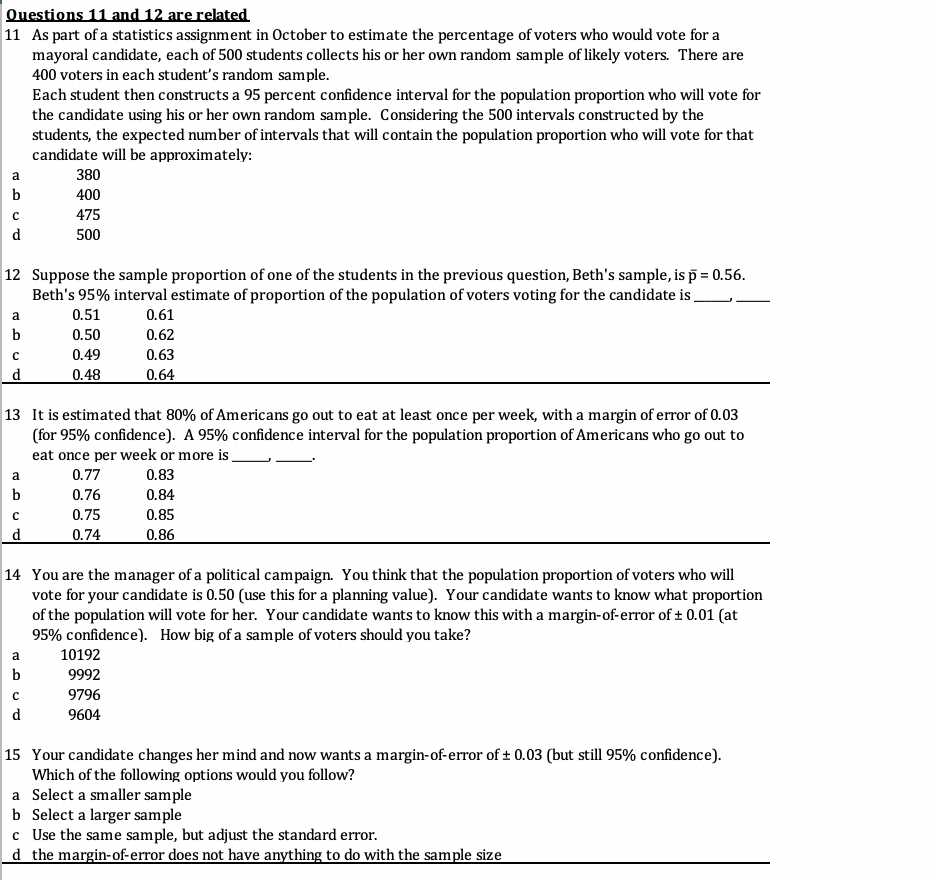
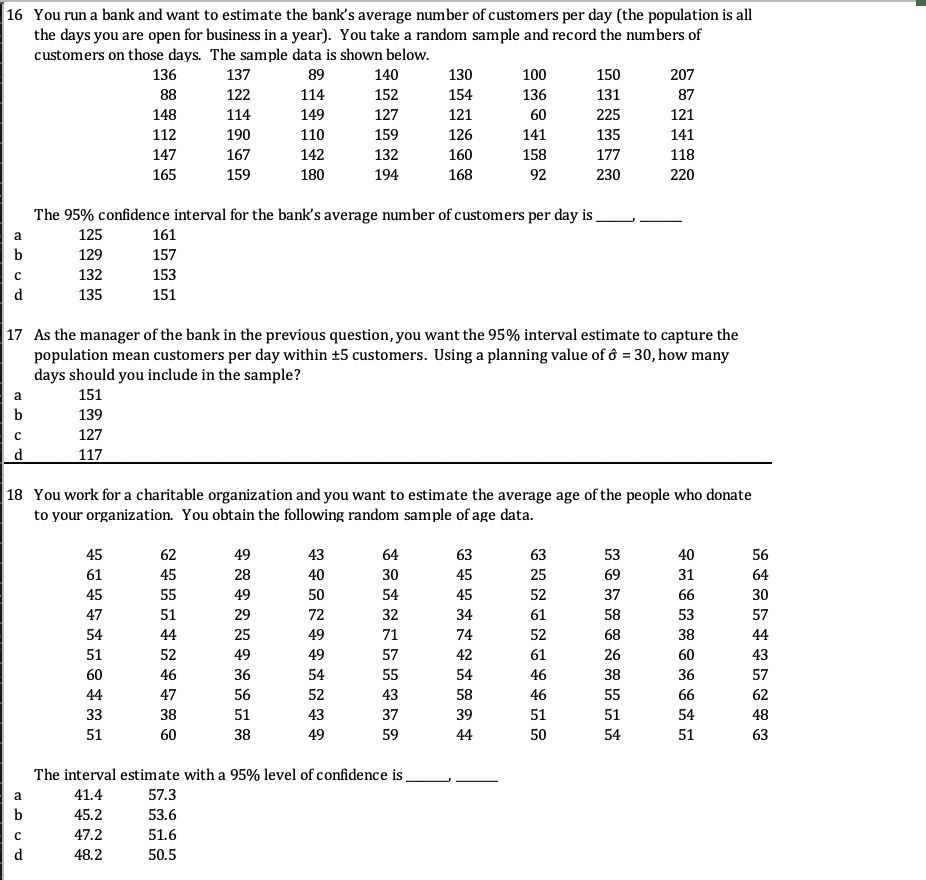
You run a gizmo factory. The following data shows the daily output of your factory for the past year. 495 467 476 494 474 488 462 492 480 470 495 499 494 481 477 481 468 470 496 500 492 477 488 489 488 476 479 478 471 484 476 493 499 491 486 477 503 484 532 515 467 444 466 464 475 484 498 476 483 506 470 483 446 471 478 454 473 465 491 460 467 506 501 492 477 529 493 471 468 505 454 492 500 471 467 477 485 472 478 486 446 500 496 494 485 475 493 447 508 478 511 487 498 512 446 489 458 461 493 477 477 484 464 191 470 461 486 501 484 470 476 476 483 190 457 478 480 491 462 483 478 499 467 500 484 487 473 511 517 479 470 472 481 458 471 495 451 485 491 482 446 482 477 507 498 491 433 488 501 496 466 503 461 511 524 459 487 467 462 473 460 193 494 163 474 468 485 497 457 448 480 479 485 460 494 480 463 480 475 506 475 510 490 477 470 494 483 474 466 471 511 499 487 487 502 502 482 442 468 490 498 470 501 486 461 499 472 458 469 463 451 461 485 492 472 497 493 445 477 456 509 502 484 461 186 493 515 489 487 485 462 481 484 463 480 465 508 490 480 490 458 450 503 496 491 479 485 469 449 479 499 475 480 486 489 466 477 479 496 481 485 414 454 452 492 504 482 451 450 445 465 482 506 194 465 487 492 449 496 480 480 490 501 477 520 502 472 473 466 480 499 490 476 469 475 493 467 464 505 455 462 469 470 485 492 445 473 465 489 511 433 477 497 500 474 502 483 510 481 471 496 470 470 469 466 483 472 157 437 467 196 452 503 463 467 473 491 472 471 461 451 469 468 481 485 473 457 461 475 479 466 478 499 462 476 499 464 483 471 451 Use the data above to answer questions 1-4 below. You take repeated random samples of size n = 25 days from the above population data. 1 The expected value of the sample means is 484.472 479.675 474.926 470.224 2 In the previous question the variance of the sample mean is. 9.781 12.226 61.132 305.6583 Using the population mean and standard deviation in question 1, what is the probability that the mean of a random sample of n = 25 days exceeds 485 gizmos? 0.0639 0.0799 0.0998 0.1248 4 Using the population data above, in repeated samples of size n = 25, 95% of sample means fall within that fall within + gizmos from the population mean. 9.06 7.88 6.85 5.96 Questions 5-7 are related to the following information In the population of employees in your company, 30 percent contribute to the annual United Way campaign. You plan to take a sample of size n = 200 and calculate the sample proportion who contribute to United Way. 5 In random samples of size n = , the expected value of the sample proportion is . 0.35 0.32 0.30 0.021 6 In the previous question, the standard error of the sample proportion is: 0.0560 0.0467 0.0402 0.0324 95% percent of sample proportions from samples of size n = 200 deviate from the population proportion of = 0.30 by no more that + (or _ percentage points). 0.033 (3.3 percentage points. ) 0.041 (4.1 percentage points.) 0.051 (5.1 percentage points.) 0.064 (6.4 percentage points.) 8 There is a population of 10 families in a small neighborhood. You plan to take a random sample of 4 families (without replacement). How many samples of size n = 4 are possible? 40 80 210 400 9 The expression P (u - 1.96 -= = = = u + 1.96 -) =0.95 means: a In repeated sampling the probability that population mean is within +1.960/vn from x is 0.95. b In repeated sampling the probability that x is within #1.960/Vn from the population mean is 0.95. 95% of sample means deviate from the population mean by no more than 1.960/vn in either direction. d Both b and c are correct. 10 The population proportion of Americans with diabetes is 11 percent (n = 0.11). In repeated random samples of n = 900 Americans, 95% of sample proportions of people with diabetes would fall within +_ from It. 0.016 (1.6 percentage point) 0.020 (2.0 percentage points) 0.026 (2.6 percentage points) 0.032 (3.2 percentage points)Questions 11 and 12 are related 11 As part of a statistics assignment in October to estimate the percentage of voters who would vote for a mayoral candidate, each of 500 students collects his or her own random sample of likely voters. There are 400 voters in each student's random sample. Each student then constructs a 95 percent confidence interval for the population proportion who will vote for the candidate using his or her own random sample. Considering the 500 intervals constructed by the students, the expected number of intervals that will contain the population proportion who will vote for that candidate will be approximately: 380 400 475 500 12 Suppose the sample proportion of one of the students in the previous question, Beth's sample, is p = 0.56. Beth's 95% interval estimate of proportion of the population of voters voting for the candidate is 0.51 0.61 0.50 0.62 0.49 0.63 0.48 0.64 13 It is estimated that 80% of Americans go out to eat at least once per week, with a margin of error of 0.03 for 95% confidence). A 95% confidence interval for the population proportion of Americans who go out to eat once per week or more is . P 0.77 0.83 ).76 0.84 0.75 0.85 0.74 0.86 14 You are the manager of a political campaign. You think that the population proportion of voters who will vote for your candidate is 0.50 (use this for a planning value). Your candidate wants to know what proportion of the population will vote for her. Your candidate wants to know this with a margin-of-error of + 0.01 (at 95% confidence). How big of a sample of voters should you take? 10192 9992 9796 9604 15 Your candidate changes her mind and now wants a margin-of-error of + 0.03 (but still 95% confidence). Which of the following options would you follow? Select a smaller sample b Select a larger sample Use the same sample, but adjust the standard error. the margin-of-error does not have anything to do with the sample size16 You run a bank and want to estimate the bank's average number of customers per day (the population is all the days you are open for business in a year). You take a random sample and record the numbers of customers on those days. The sample data is shown below. 137 89 130 100 136 140 150 207 131 87 88 122 114 152 154 136 114 149 127 121 60 225 121 148 159 126 141 135 141 112 190 110 147 167 142 132 160 158 177 118 165 159 180 194 168 92 230 220 The 95% confidence interval for the bank's average number of customers per day is 125 161 129 157 132 153 135 151 17 As the manager of the bank in the previous question, you want the 95% interval estimate to capture the population mean customers per day within 15 customers. Using a planning value of o = 30, how many days should you include in the sample? 151 139 127 117 18 You work for a charitable organization and you want to estimate the average age of the people who donate to your organization. You obtain the following random sample of age data. 53 40 56 45 62 49 43 64 63 63 25 69 31 64 61 28 30 54 45 52 37 66 30 45 55 49 50 61 58 57 47 51 29 72 32 34 44 25 49 71 74 52 54 51 49 49 57 42 61 52 46 36 54 55 54 46 60 56 52 43 58 46 44 47 51 43 37 39 51 38 38 59 44 50 51 60 The interval estimate with a 95% level of confidence is 41.4 57.3 45.2 53.6 47.2 51.6 48.2 50.5


