Hi, Can you please help me with this exercice? it is due on June 24th, at 2pm.
Chapter 13 - ex 16
?Revisiting the inflation shock (hard): Reread the inflation shock example (event#1) in Section 13.5. Suppose the size of the shock is o bar 0.
(a)In the AS/AD graphs describing the response of the economy to theinflation shock, we labeled the initial response of inflation as 1 andinitial output as Y~1.
What are the values of these key points in terms ofthe parameters of the model?
That is, by how much does output fall, andwhat is the initial inflation rate?
(b)Now suppose the parameters of the AS and AD curves take the followingvalues: o0 = 2%, a = 0, b = 1/2,m = 1/2, ? = 1/2, and = 2%. Solvefor the value of short-run output and the inflation rate for the first 3 yearsafter the shock.
(c)Comment briefly on your results.
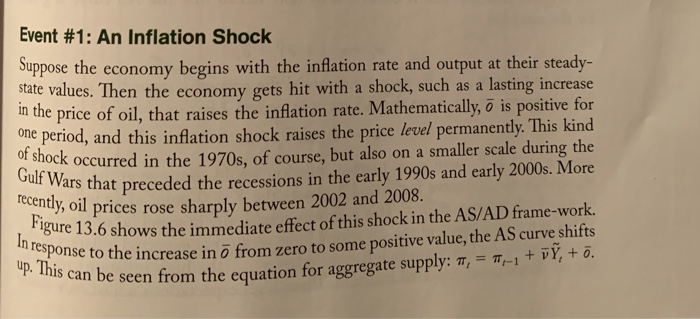
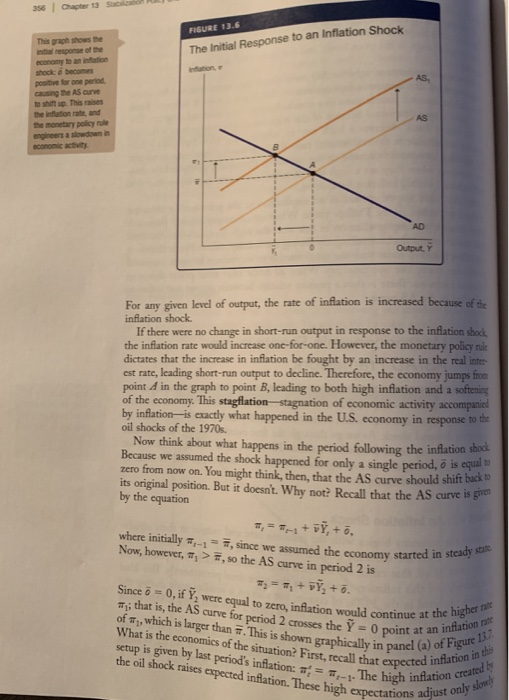
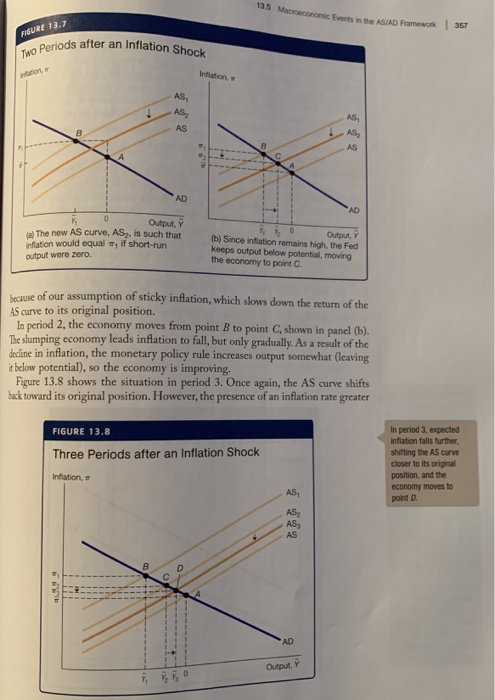
16. Revisiting the inflation shock (hard): Reread the inflation shock example (event #1) in Section 13.5. Suppose the size of the shock is do. (a) In the AS/AD graphs describing the response of the economy to the inflation shock, we labeled the initial response of inflation as m, and initial output as Y,. What are the values of these key points in terms of the parameters of the model? That is, by how much does output fall, and what is the initial inflation rate? (b) Now suppose the parameters of the AS and AD curves take the following values: 00 = 2%, a = 0, b = 1/2, m = 1/2, v = 1/2, and 7 = 2%. Solve for the value of short-run output and the inflation rate for the first 3 years after the shock. (c) Comment briefly on your results.Event #1: An Inflation Shock Suppose the economy begins with the inflation rate and output at their steady- state values. Then the economy gets hit with a shock, such as a lasting increase in the price of oil, that raises the inflation rate. Mathematically, o is positive for one period, and this inflation shock raises the price level permanently. This kind of shock occurred in the 1970s, of course, but also on a smaller scale during the Gulf Wars that preceded the recessions in the early 1990s and early 2000s. More recently, oil prices rose sharply between 2002 and 2008. Figure 13.6 shows the immediate effect of this shock in the AS/AD frame-work. In response to the increase in o from zero to some positive value, the AS curve shifts up. This can be seen from the equation for aggregate supply: , = / + VY, + .356 Chapter 13 FIGURE 10.6 This graph Shows Be The Initial Response to an Inflation Shock initial response al the active lor ood period AS causing The AS curve 10 shift up. This noises The Inflation rate, and AS The monetary policy rule engineers a slowdown in economic activity An Output. Y For any given level of output, the rate of inflation is increased because of the inflation shock. If there were no change in short-run output in response to the inflation shock, the inflation rate would increase one-for-one. However, the monetary policy nik dictates that the increase in inflation be fought by an increase in the real inter- est rate, leading short-run output to decline. Therefore, the economy jumps from point d in the graph to point B, leading to both high inflation and a softening of the economy. This stagflation-stagnation of economic activity accompanied by inflation-is exactly what happened in the U.S. economy in response to the oil shocks of the 1970s. Now think about what happens in the period following the inflation shock Because we assumed the shock happened for only a single period, o is equal to zero from now on. You might think, then, that the AS curve should shift back to by the equation its original position. But it doesn't. Why not? Recall that the AS curve is given where initially #,-1 = #, since we assumed the economy started in steady state Now, however, " > #, so the AS curve in period 2 is Since 6 = 0, if Y, were equal to zero, inflation would continue at the higher name 13 ; that is, the AS curve for period 2 crosses the V = 0 point at an inflation - of a , which is larger than w. This is shown graphically in panel (a) of Figure 13. What is the economics of the situation? First, recall that expected inflation in the setup is given by last period's inflation: a = _. The high inflation created the oil shock raises expected inflation. These high expectations adjust only slow!135 Maconconomic Events in the AS/AD Framework FIGURE 13.7 |357 Two Periods after an Inflation Shock nation, IT Inflation, AS B AS AD AD Output, Y (3) The new AS curve, ASy, is such that Output, Y Inflation would equal a if short-run (b) Since inflation remains high, the Fed output were zero. keeps output below potential, moving the economy to point C. because of our assumption of sticky inflation, which slows down the return of the As curve to its original position. In period 2, the economy moves from point B to point C, shown in panel (b). The slumping economy leads inflation to fall, but only gradually. As a result of the decline in inflation, the monetary policy rule increases output somewhat (leaving it below potential), so the economy is improving. Figure 13.8 shows the situation in period 3. Once again, the AS curve shifts back toward its original position. However, the presence of an inflation rate greater FIGURE 13.8 In period 3, expected Inflation falls further, Three Periods after an Inflation Shock shifting the AS curve closer to its original Inflation, # position, and the AS economy moves to point D. AS AS AS Output, Y350 Chapter 13 Stabilization Policy and the AS/AD Framework than # leads expected inflation to exceed the target rate. The economy gradually adjusts toward steady state, moving to point D. Figure 13.9 provides a way of summarizing the dynamics of inflation and outper in the AS/AD framework. The economy initially j ially jumps from point A to p when the inflation shock hits, and then it moves gradually over time back toward the steady state at point /4. This makes perfect sense if you think about it. The steady state of this AS/AD model is point , where inflation is # and output is potential. So it is quite natural that the economy moves back to this steady state The adjustment occurs as expected inflation declines gradually, causing the AS curve to shift back toward its original position. Our sticky inflation assumption is at the heart of this gradual adjustment. The careful reader will notice that the principle of transition dynamics, which we first encountered in the long-run model, also applies in the AS/AD framework the movement back toward the steady state is fastest when the economy is further from its steady state. Then, as we saw in Figures 13.7 and 13.8, the movement back gets slower as the economy approaches its steady state. The lesson from this event is that price shocks that raise inflation are especially insidious. First, they raise inflation directly. Next, the central bank induces a reces- sion to bring the inflation rate back to its long-run target. Even though the shock lasts for only a single period, inflation remains higher for an extended period of time, because of sticky inflation. The shock raises expected inflation, and it takes a prolonged slump in the economy to get these expectations back to normal. The economy suffers stagflation-stagnation and inflation simultaneously - just as it did in the 1970s. A positive inflation shock-a one-time Increase in o that lasts for a single period- FIGURE 13.9 causes the AS curve to shift up and leads the The Effects of an Inflation Shock: Summary economy to jump from Inflation, ir paint A to point &. The monetary policy rule dictates a decline in AS output in order to fight this Inflation. Through the Phillips curve, the slumping economy AS causes inflation to come down gradually. shifting the AS curve back toward its original position bit by bit. The economy transits slowly back to its steady state of point A [the transitional shifts are Indicated with arrows). AD Output, Y