Answered step by step
Verified Expert Solution
Question
1 Approved Answer
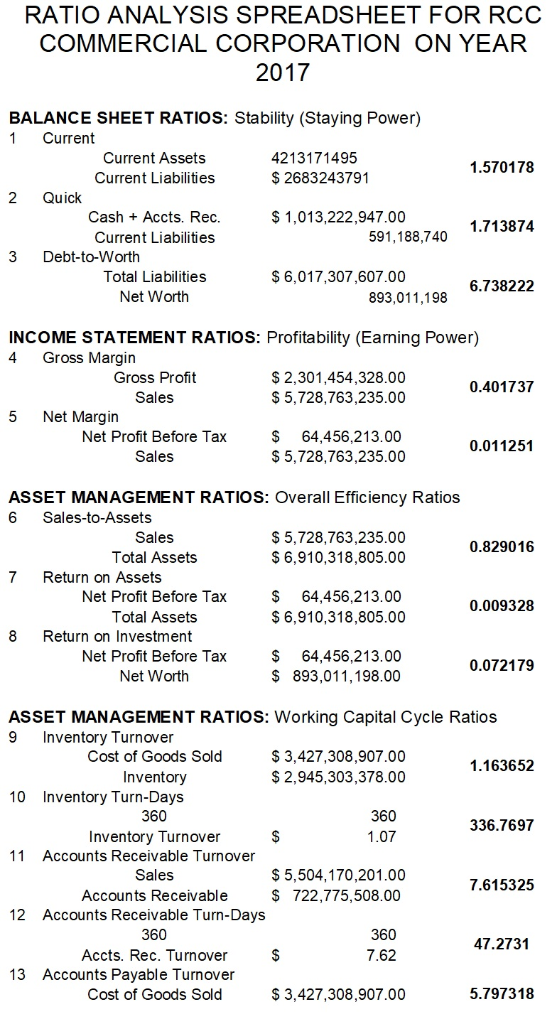
Hi, Chegg Tutor, Please help me do a financial analysis on the statement of cash flows stated above. This is a department store in philippines.

Hi, Chegg Tutor, Please help me do a financial analysis on the statement of cash flows stated above.
This is a department store in philippines.
RATIO ANALYSIS SPREADSHEET FOR RCC COMMERCIAL CORPORATION ON YEAR 2017 BALANCE SHEET RATIOS: Stability (Staying Power) 1 Current Current Assets Current Liabilities 4213171495 $ 2683243791 1.570178 2 Quick Cash Accts. Rec Current Liabilities $ 1,013,222,947.00 1.713874 591,188,740 3 Debt-to-Worth $ 6,017,307,607.00 Total Liabilities Net Worth 6.738222 893,011,198 INCOME STATEMENT RATIOS: Profitability (Earning Power) 4 Gross Margin Gross Profit Sales $ 2,301,454,328.00 $ 5,728,763,235.00 0.401737 5 Net Margin Net Profit Before Tax Sales $ 64,456,213.00 $ 5,728,763,235.00 0.011251 ASSET MANAGEMENT RATIOS: Overall Efficiency Ratios 6 Sales-to-Assets Sales Total Assets $ 5,728,763,235.00 $ 6,910,318,805.00 0.829016 7 Return on Assets Net Profit Before Tax Total Assets $ 64,456,213.00 $ 6,910,318,805.00 0.009328 8 Return on Investment Net Profit Before Tax Net Worth $ 64,456,213.00 $ 893,011,198.00 0.072179 ASSET MANAGEMENT RATIOS: Working Capital Cycle Ratios 9Inventory Turnover Cost of Goods Sold Inventory $ 3,427,308,907.00 $ 2,945,303,378.00 1.163652 10 Inventory Turn-Days 360 Inventory Turnover Accounts Receivable Turnover Sales Accounts Receivable Accounts Receivable Turn-Days 360 Accts. Rec. Turnover 360 1.07 336.7697 11 $ 5,504,170,201.00 $ 722,775,508.00 7.615325 12 360 7.62 47.2731 13 Accounts Payable Turnover Cost of Goods Sold $ 3,427,308,907.00 5.797318 RATIO ANALYSIS SPREADSHEET FOR RCC COMMERCIAL CORPORATION ON YEAR 2017 BALANCE SHEET RATIOS: Stability (Staying Power) 1 Current Current Assets Current Liabilities 4213171495 $ 2683243791 1.570178 2 Quick Cash Accts. Rec Current Liabilities $ 1,013,222,947.00 1.713874 591,188,740 3 Debt-to-Worth $ 6,017,307,607.00 Total Liabilities Net Worth 6.738222 893,011,198 INCOME STATEMENT RATIOS: Profitability (Earning Power) 4 Gross Margin Gross Profit Sales $ 2,301,454,328.00 $ 5,728,763,235.00 0.401737 5 Net Margin Net Profit Before Tax Sales $ 64,456,213.00 $ 5,728,763,235.00 0.011251 ASSET MANAGEMENT RATIOS: Overall Efficiency Ratios 6 Sales-to-Assets Sales Total Assets $ 5,728,763,235.00 $ 6,910,318,805.00 0.829016 7 Return on Assets Net Profit Before Tax Total Assets $ 64,456,213.00 $ 6,910,318,805.00 0.009328 8 Return on Investment Net Profit Before Tax Net Worth $ 64,456,213.00 $ 893,011,198.00 0.072179 ASSET MANAGEMENT RATIOS: Working Capital Cycle Ratios 9Inventory Turnover Cost of Goods Sold Inventory $ 3,427,308,907.00 $ 2,945,303,378.00 1.163652 10 Inventory Turn-Days 360 Inventory Turnover Accounts Receivable Turnover Sales Accounts Receivable Accounts Receivable Turn-Days 360 Accts. Rec. Turnover 360 1.07 336.7697 11 $ 5,504,170,201.00 $ 722,775,508.00 7.615325 12 360 7.62 47.2731 13 Accounts Payable Turnover Cost of Goods Sold $ 3,427,308,907.00 5.797318Step by Step Solution
There are 3 Steps involved in it
Step: 1

Get Instant Access to Expert-Tailored Solutions
See step-by-step solutions with expert insights and AI powered tools for academic success
Step: 2

Step: 3

Ace Your Homework with AI
Get the answers you need in no time with our AI-driven, step-by-step assistance
Get Started


