

Answered step by step
Verified Expert Solution
Question
1 Approved Answer
Hi could you help solving this problem please? 5) In the instructor video, titration curves and first derivative graphs (slope plots) are shown for a
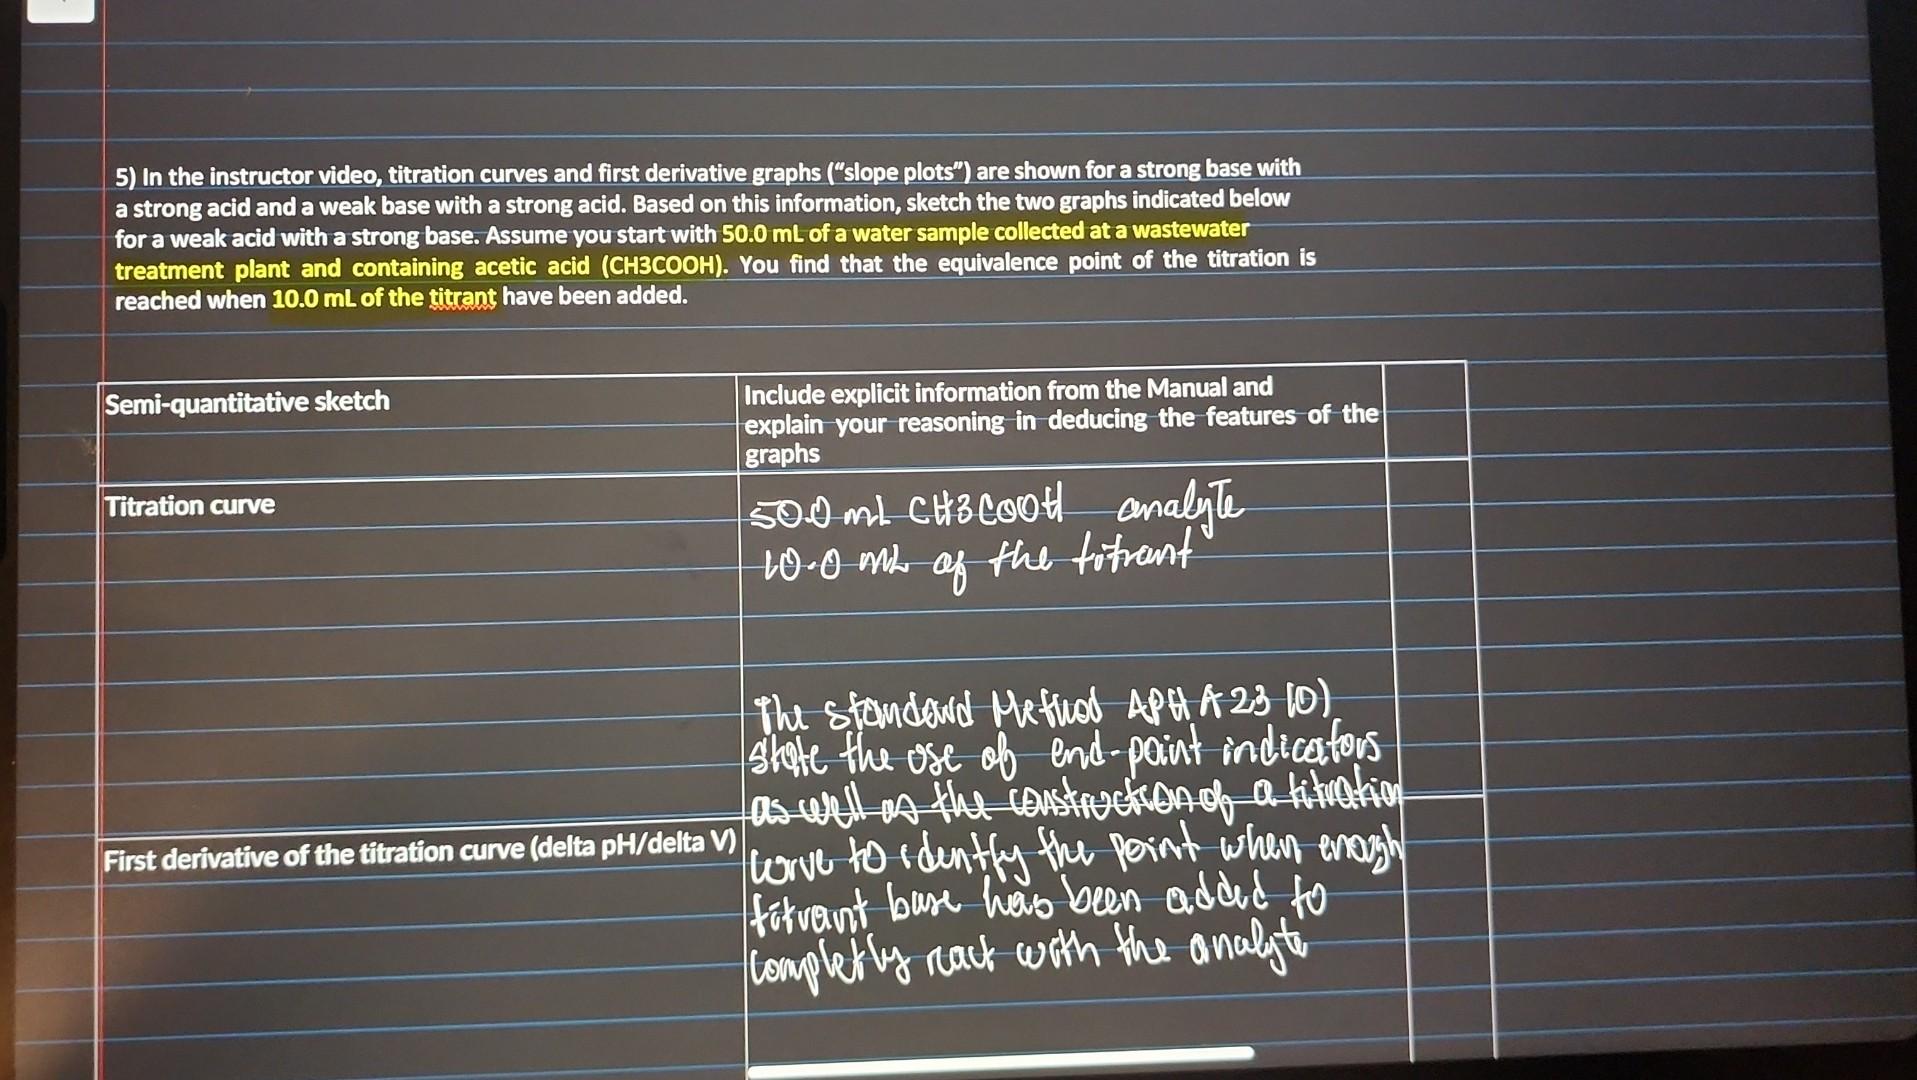
Hi could you help solving this problem please?
5) In the instructor video, titration curves and first derivative graphs ("slope plots") are shown for a strong base with a strong acid and a weak base with a strong acid. Based on this information, sketch the two graphs indicated below for a weak acid with a strong base. Assume you start with 50.0mL of a water sample collected at a wastewater treatment plant and containing acetic acid (CH3COOH). You find that the equivalence point of the titration is reached when 10.0mL of the titrant have been added
Step by Step Solution
There are 3 Steps involved in it
Step: 1

Get Instant Access to Expert-Tailored Solutions
See step-by-step solutions with expert insights and AI powered tools for academic success
Step: 2

Step: 3
Ace Your Homework with AI
Get the answers you need in no time with our AI-driven, step-by-step assistance
Get Started
Physical Chemistry for the Life Sciences
Authors: Peter Atkins, Julio de Paula
1st edition
199564286, 199564280, 978-0119470079