Hi dear, Can you help me with this, please?
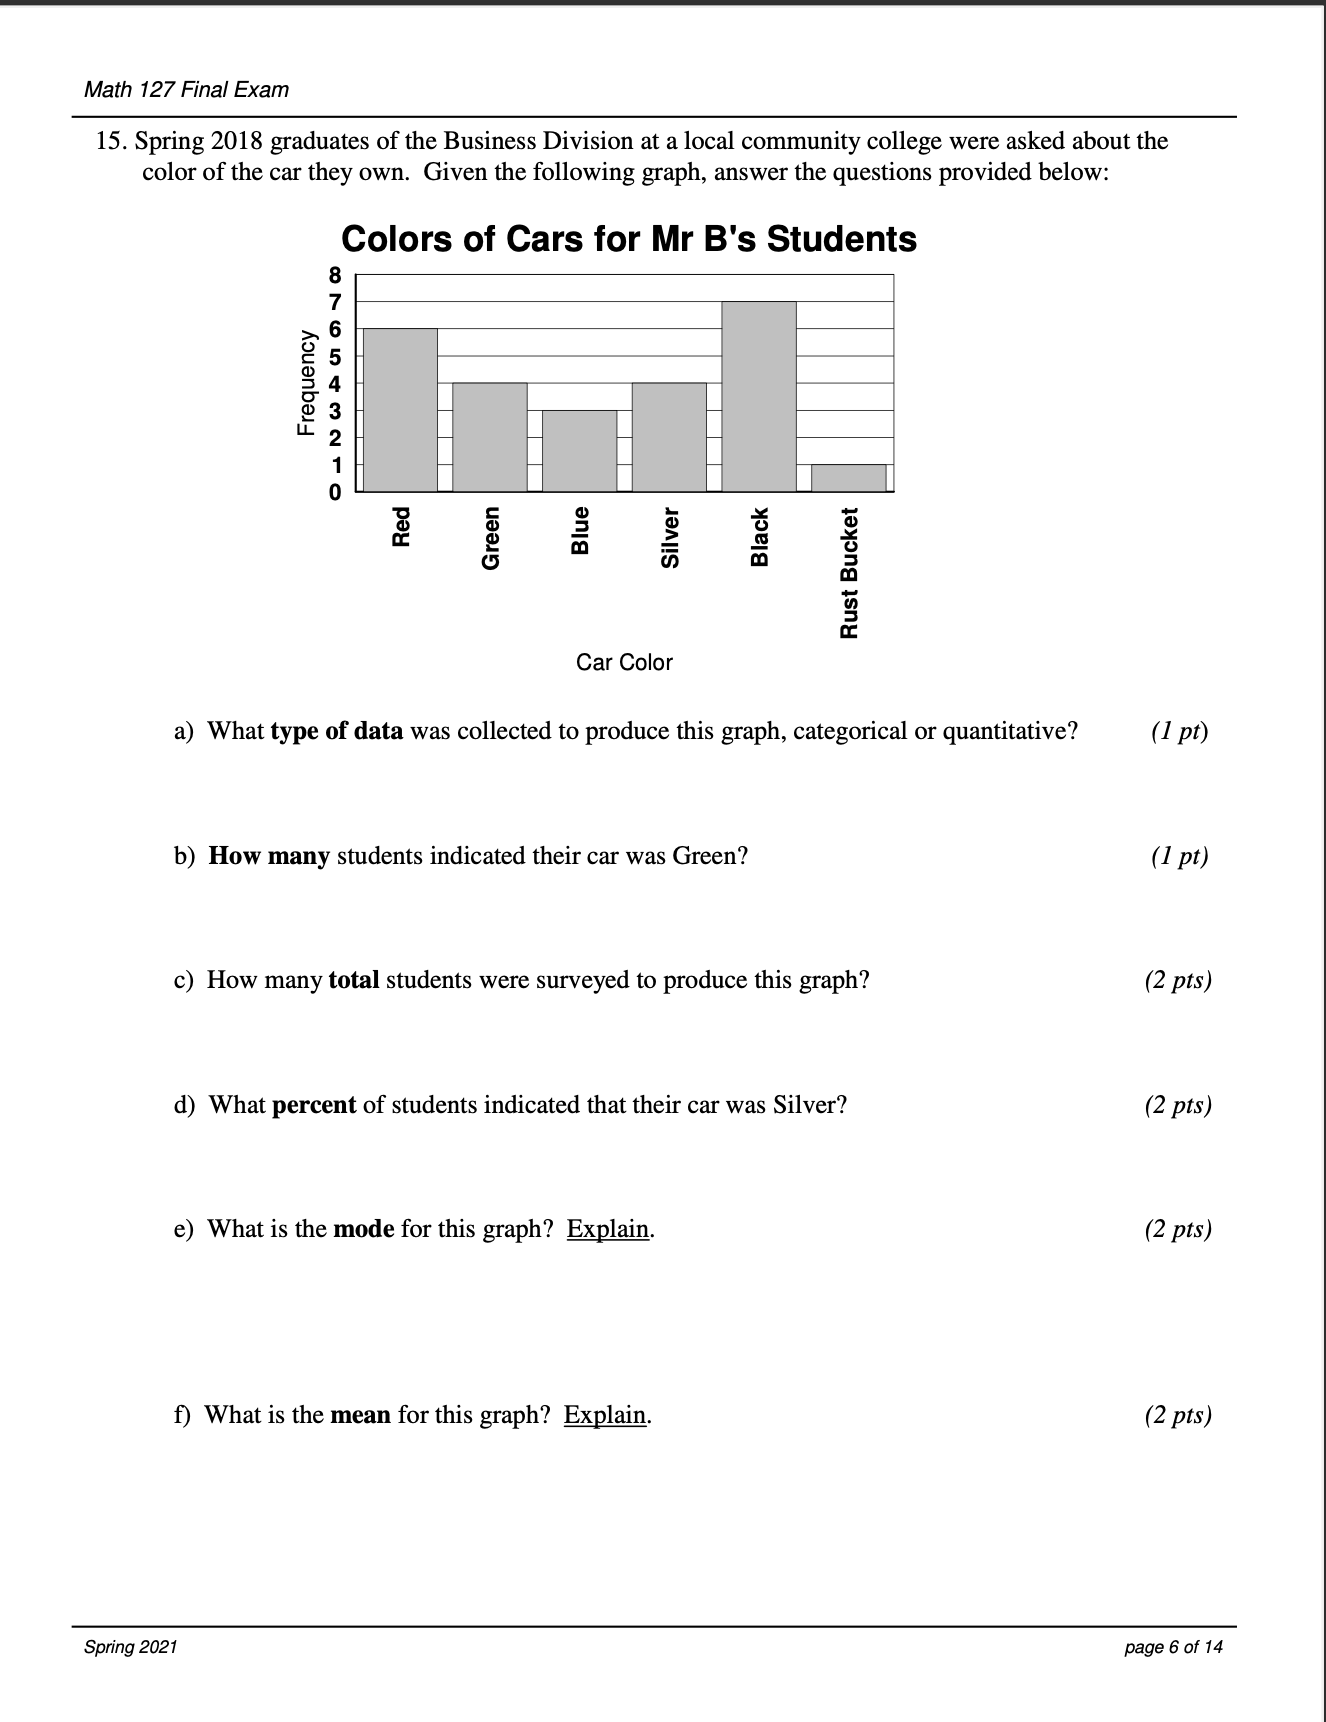
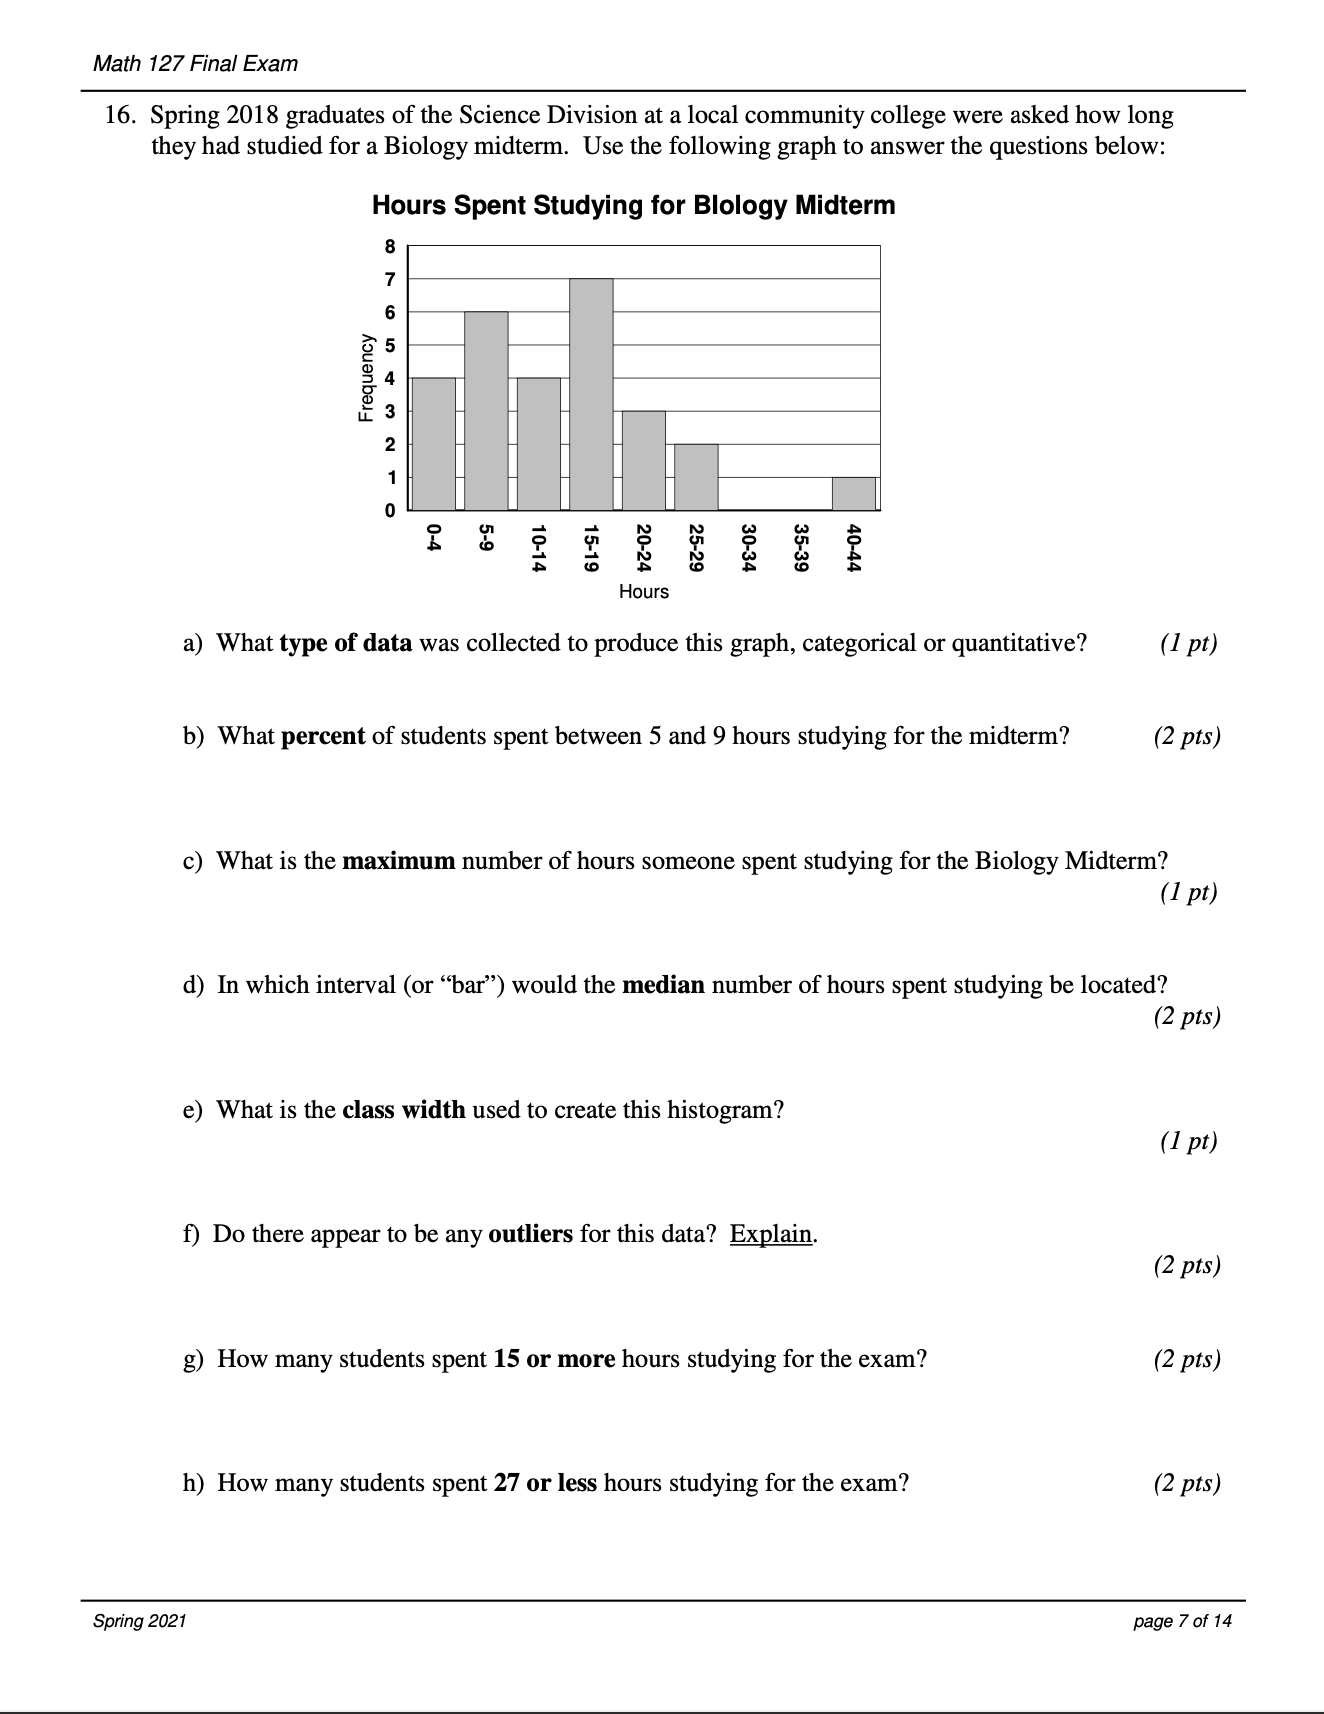
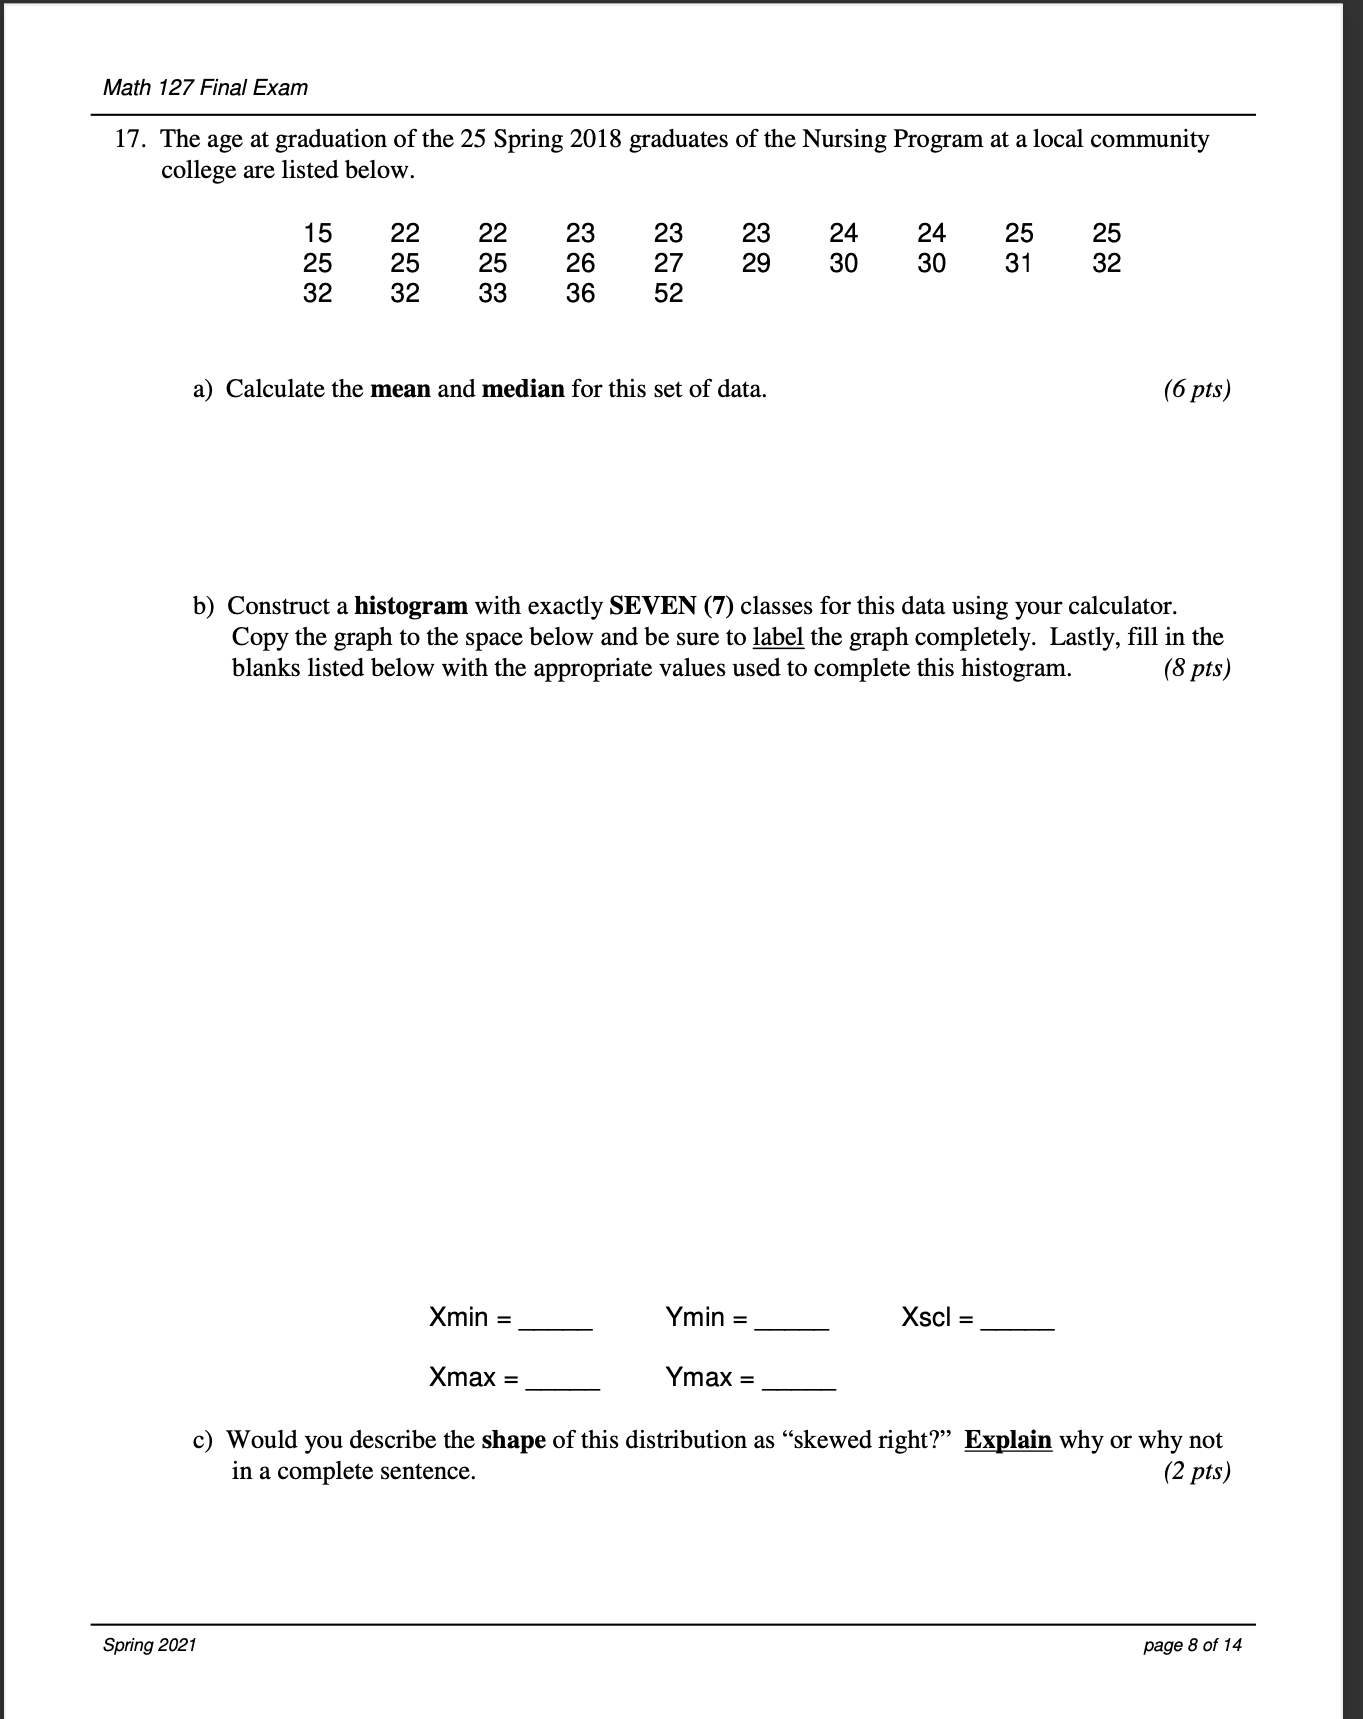
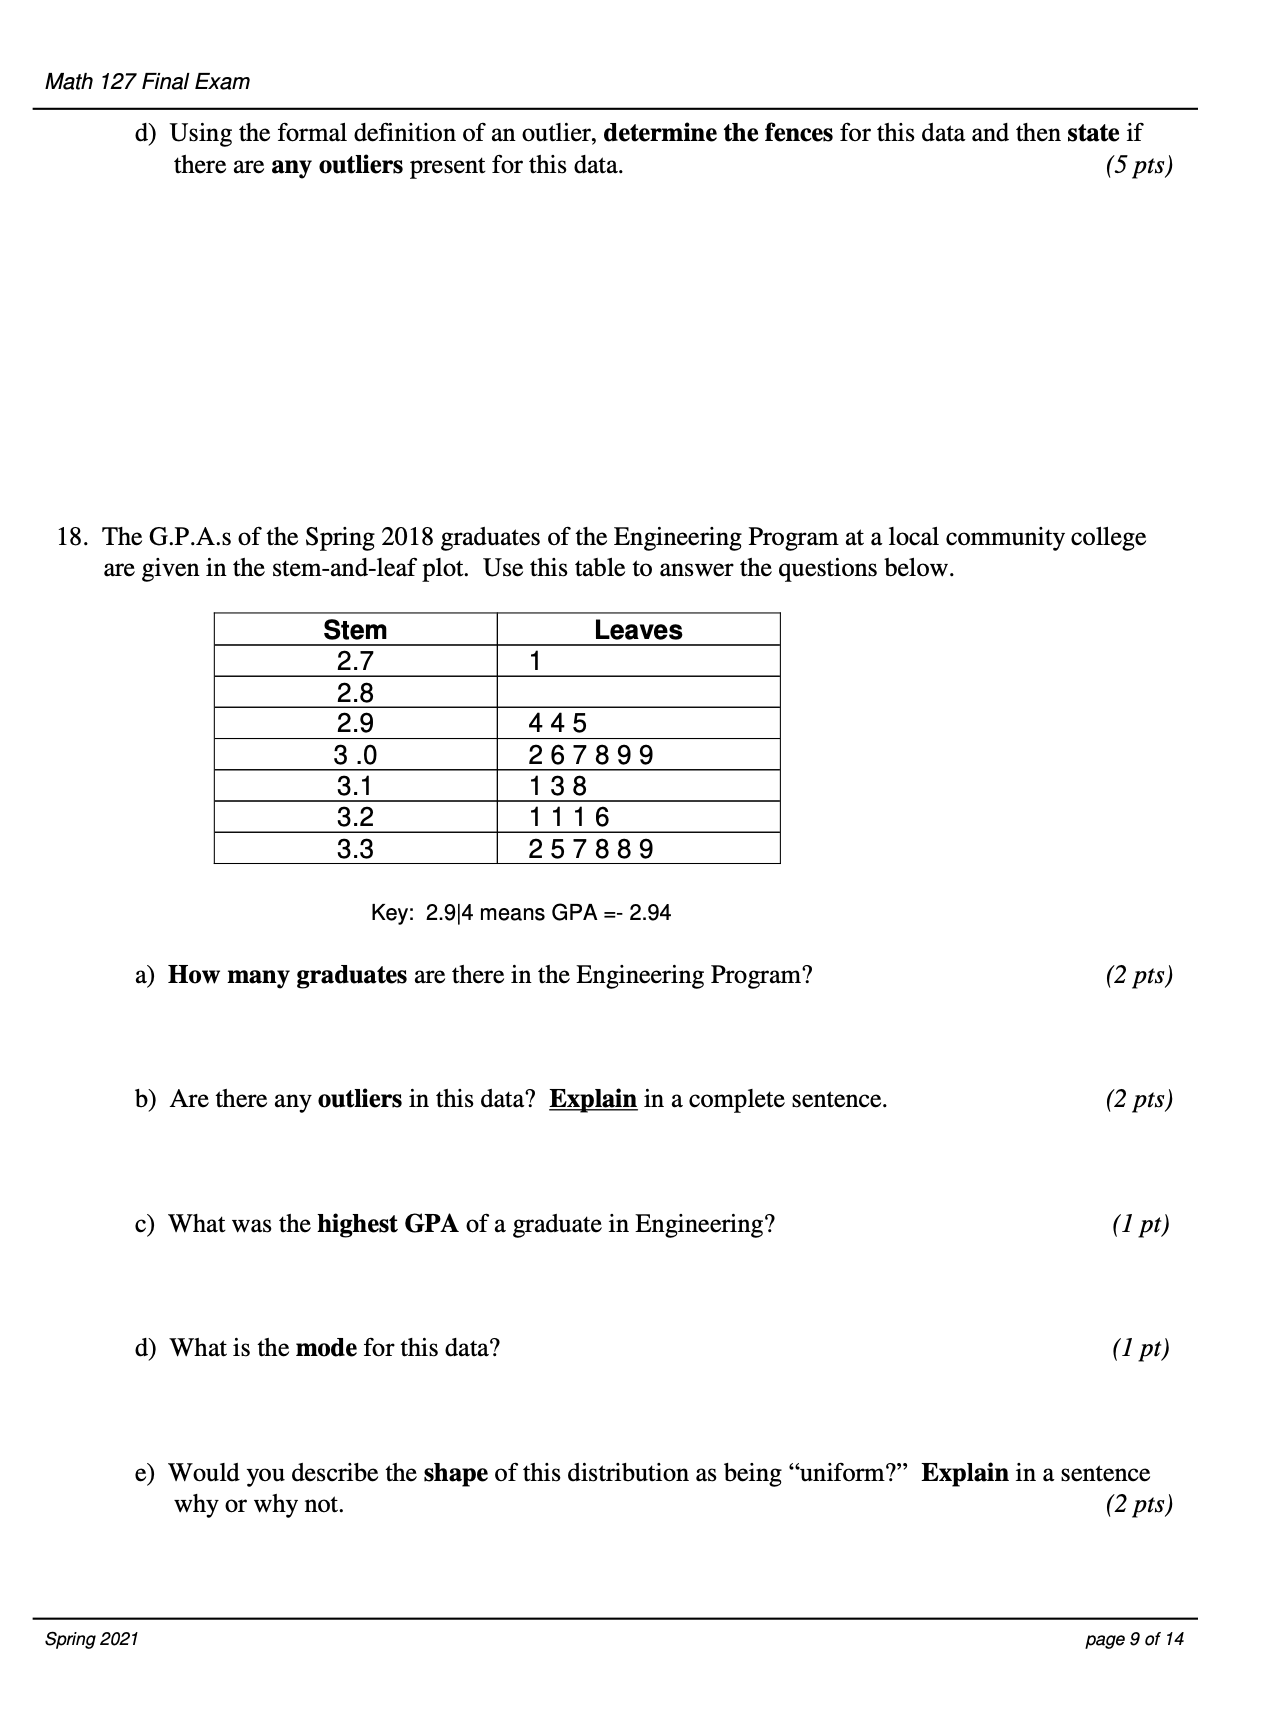
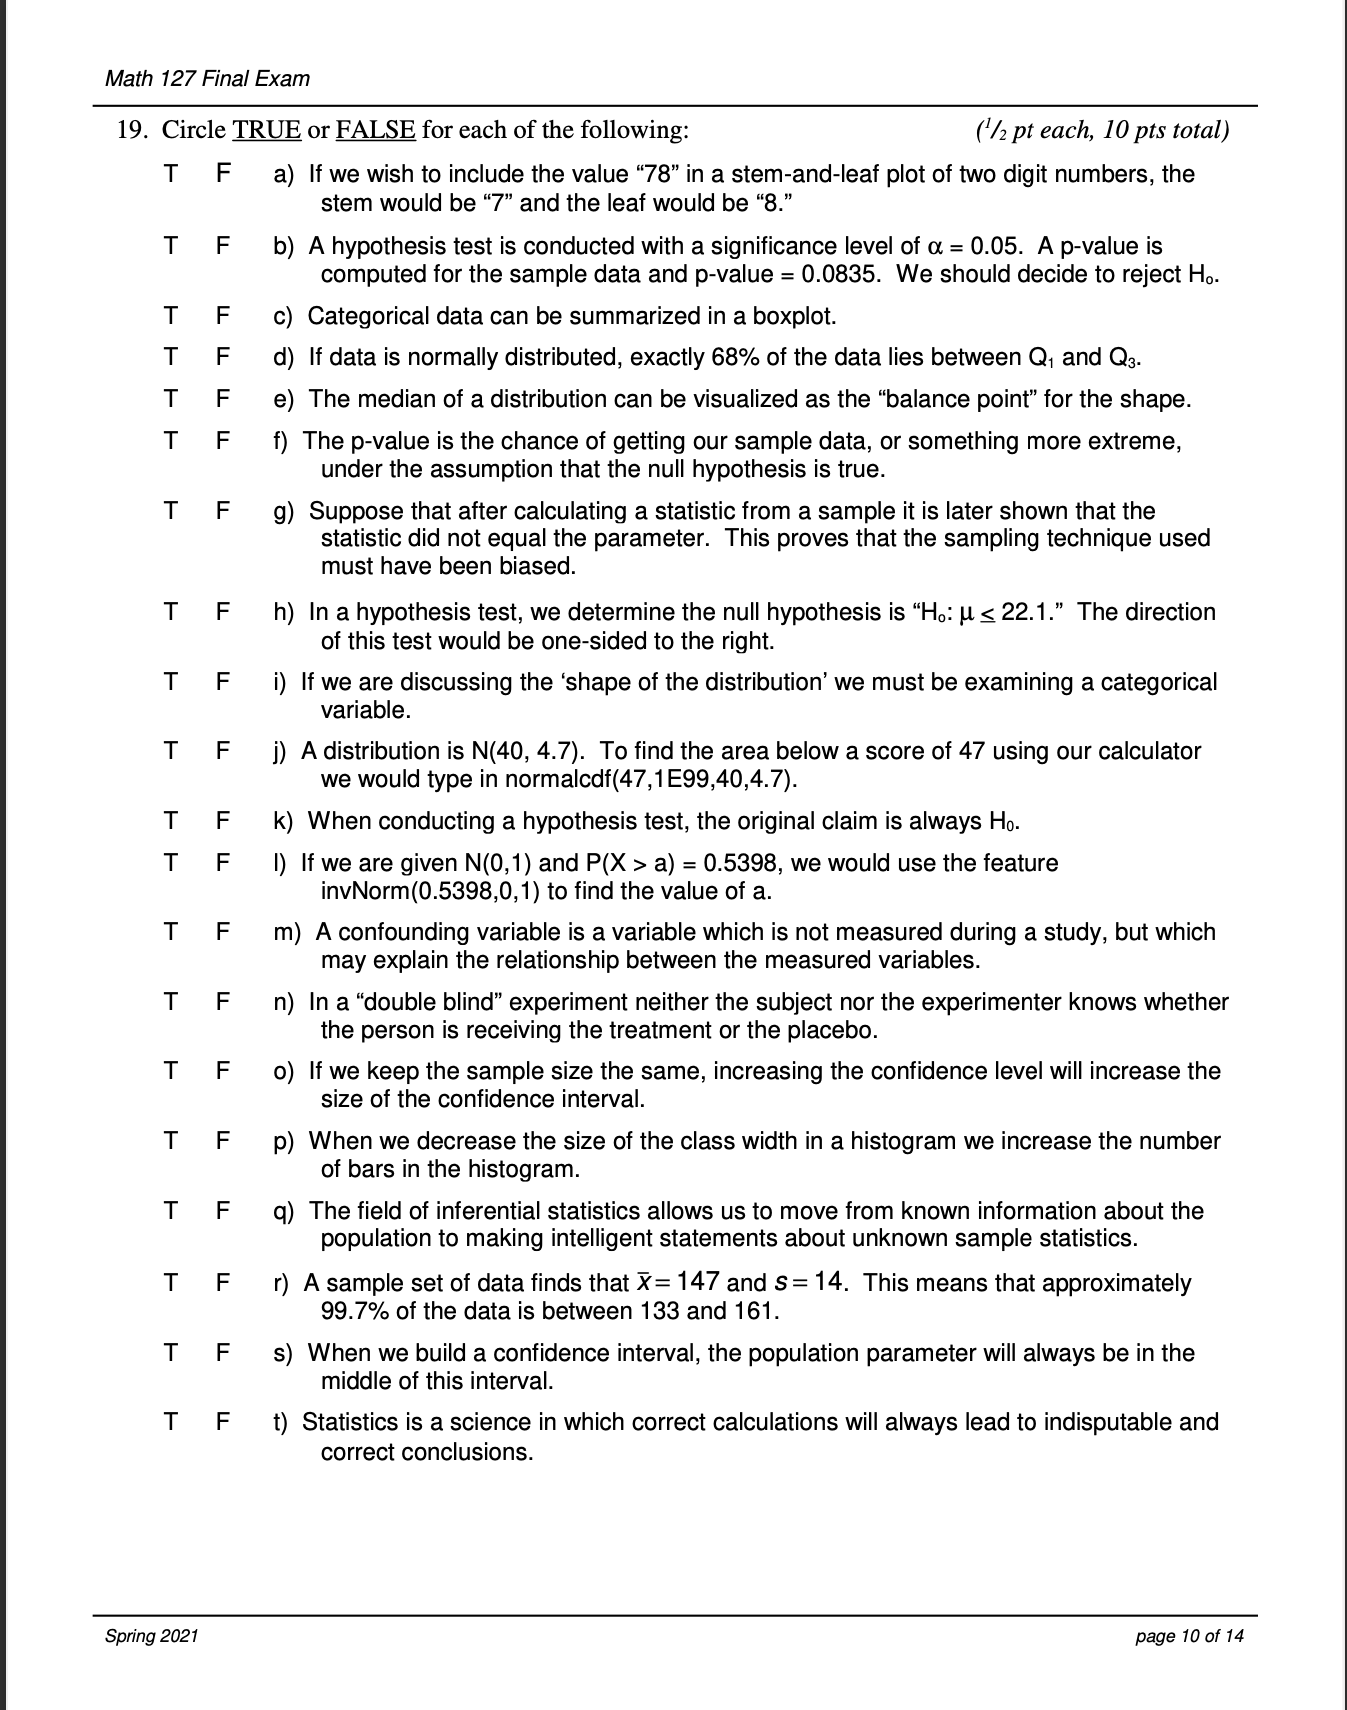
Math 127 Final Exam 15. Spring 2018 graduates of the Business Division at a local community college were asked about the color of the car they own. Given the following graph, answer the questions provided below: Colors of Cars for Mr B's Students 8 7 >.5| 5| =4 33' n.2I 1 I I 0 '8 C 0 '- a: "' o: E 3 9 g 3 (5 m 5 E 3 "'5' r. CarCoIor a) What type of data was collected to produce this graph, categorical or quantitative? b) How many students indicated their car was Green? c) How many total students were surveyed to produce this graph? d) What percent of students indicated that their car was Silver? e) What is the mode for this graph? Explain. f) What is the mean for this graph? Explain. Spring 2021 (1 PI) (1171') ( 2 INS) (2 pts} (2 INS) (2 P's) pageof 14 Math 127 Final Exam 16. Spring 2018 graduates of the Science Division at a local community college were asked how long they had studied for a Biology midterm. Use the following graph to answer the questions below: Hours Spent Studylng for Blology Mldterm a 7 6 g 5 S 4 E 3 2 1 o D 01 -I- -|- N M H L b 3 3 :2 3 3 E h b h a h @ Hours a) What type of data was collected to produce this graph, categorical or quantitative? (1 pt) b) What percent of students spent between 5 and 9 hours studying for the midterm? (2 pts) c) What is the maximum number of hours someone spent studying for the Biology Midterm? (1 pt) d) In which interval (or \"bar") would the median number of hours spent studying be located? (2 W) e) What is the class width used to create this histogram? (1 pt) f) Do there appear to be any outliers for this data? Explain. (2 ptS) g) How many students spent 15 or more hours studying for the exam? (2 pts) h) How many students spent 27 or loss hours studying for the exam? (2 pts) Spring 2021 page 7 of 14 Math 127 Final Exam 17. The age at graduation of the 25 Spring 2018 graduates of the Nursing Program at a local community college are listed below. 1 5 22 22 23 23 23 24 24 25 25 25 25 25 26 27 29 30 30 31 32 32 32 33 36 52 3) Calculate the mean and median for this set of data. ( 6 ptS) h) Construct a histogram with exactly SEVEN (7) classes for this data using your calculator. Copy the graph to the space below and be sure to label the graph completely. Lastly, ll in the blanks listed below with the appropriate values used to complete this histogram. (8 pts) Xmin = Ymin = Xscl = Xmax = Ymax = c) Would you describe the shape of this distribution as \"skewed right?\" Explain why or why not in a complete sentence. (2 pts) Spring 2021 page 8 of 14 Math 127 Final Exam d) Using the formal denition of an Outlier, determine the fences for this data and then state if there are any outliers present for this data. (5 pts) 18. The G.P.A.s of the Spring 2018 graduates of the Engineering Program at a local community college are given in the stem-and-leaf plot. Use this table to answer the questions below. Stern Leaves 2.7 1 2.8 2.9 4 4 5 3 .0 2 6 7 8 9 9 3.1 1 3 8 3.2 1 1 1 6 3.3 2 5 7 8 8 9 Key: 2.9|4 means GPA =- 2.94 a) How many graduates are there in the Engineering Program? (2 pts) b) Are there any outliers in this data? m in a complete sentence. (2 pts) c) What was the highest GPA of a graduate in Engineering? (1 pt) d) What is the mode for this data? (1 pt) e) Would you describe the shape of this distribution as being \"uniform?\" Explain in a sentence why or why not. (2 pts) Spring 2021 page 9 of 14 Math 1'27 Final Exam 19. Circle TRLJ E or FAQE for each of the following: (72 pt each, 10 pts total) T F a) If we wish to include the value "78\" in a stem-and-leaf plot of two digit numbers, the stem would be "7\" and the leaf would be ".\"8 T F b) A hypothesis test is conducted with a significance level of a = 0.05. A pvalue is computed for the sample data and pvalue = 0.0835. We should decide to reject H... T F c) Categorical data can be summarized in a boxplot. T F d) If data is normally distributed, exactly 68% of the data lies between 01 and 03. T F e) The median of a distribution can be visualized as the "balance point\" for the shape. T F f) The pvalue is the chance of getting our sample data, or something more extreme, under the assumption that the null hypothesis is true. T F 9) Suppose that after calculating a statistic from a sample it is later shown that the statistic did not equal the parameter. This proves that the sampling technique used must have been biased. T F h) In a hypothesis test, we determine the null hypothesis is \"Ho: 11 g 22.1 The direction of this test would be one-sided to the right. T F i) If we are discussing the 'shape of the distribution' we must be examining a categorical variable. T F j) A distribution is N(40, 4.7). To find the area below a score of 47 using our calculator we would type in normalodi(47,1E99,40,4.7). T F k) When conducting a hypothesis test, the original claim is always Hn. T F I) If we are given N(0,1) and P(X > a) = 0.5398, we would use the feature invNorm(0.5398,0,1) to find the value of a. T F m) A confounding variable is a variable which is not measured during a study, but which may explain the relationship between the measured variables. T F n) In a "double blind" experiment neither the subject nor the experimenter knows whether the person is receiving the treatment or the placebo. T F o) If we keep the sample size the same, increasing the confidence level will increase the size of the confidence interval. T F p) When we decrease the size of the class width in a histogram we increase the number of bars in the histogram. T F q) The field of inferential statistics allows us to move from known information about the population to making intelligent statements about unknown sample statistics. T F r) A sample set of data finds that 7:: 147 and s = 14. This means that approximately 99.7% of the data is between 133 and 161. T F 5) When we build a confidence interval, the population parameter will always be in the middle of this interval. T F t) Statistics is a science in which correct calculations will always lead to indisputable and Spring 2021' correct conclusions. page 10 of14 Math 127 Final Exam 22. In each of the following, you are provided information regarding a hypothesis test. You are asked to state the null and alternative hypotheses for the test. a) A college administrator fears that cheating is running rampant on their college campus. They state that they believe that more than 72% of all students have cheated on an exam before graduating. Ho: (1 Pt) Ha: (1 I\") b) A History professor in his commencement speech claims that the average graduate in the History Department had a GPA of at least 3.1. A random sample of 40 History graduates is obtained and their GPAs are calculated. Ho: up He: (1 pt) b) A spokesman for the White House states that exactly 43% of all community college graduates are planning on transferring to a 4-year college. A random sample of 220 community college graduates is obtained and the proportion transferring to a 4-year school is determined. Ho: (1 Pt) Ha: (1 pt) Spring 2021 page 13 of 14