hi everyone,
This question is not missing any part . Please answer it accordingly.
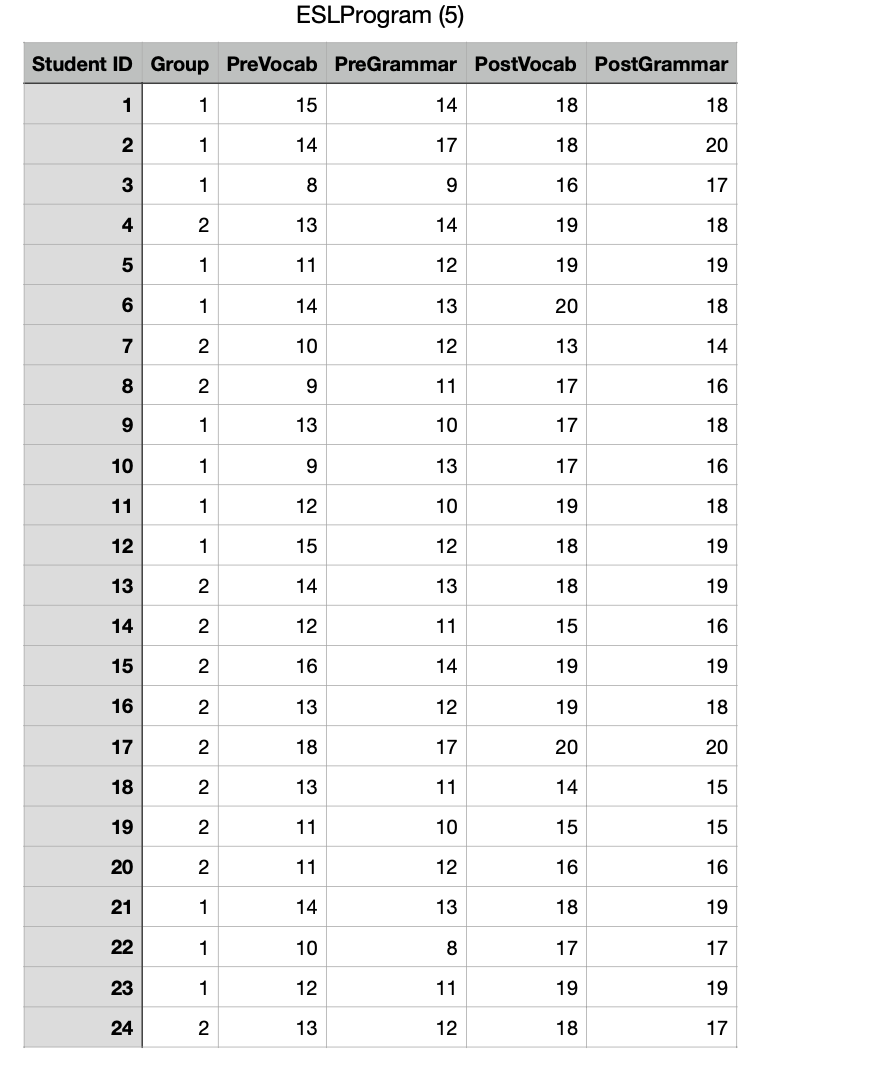
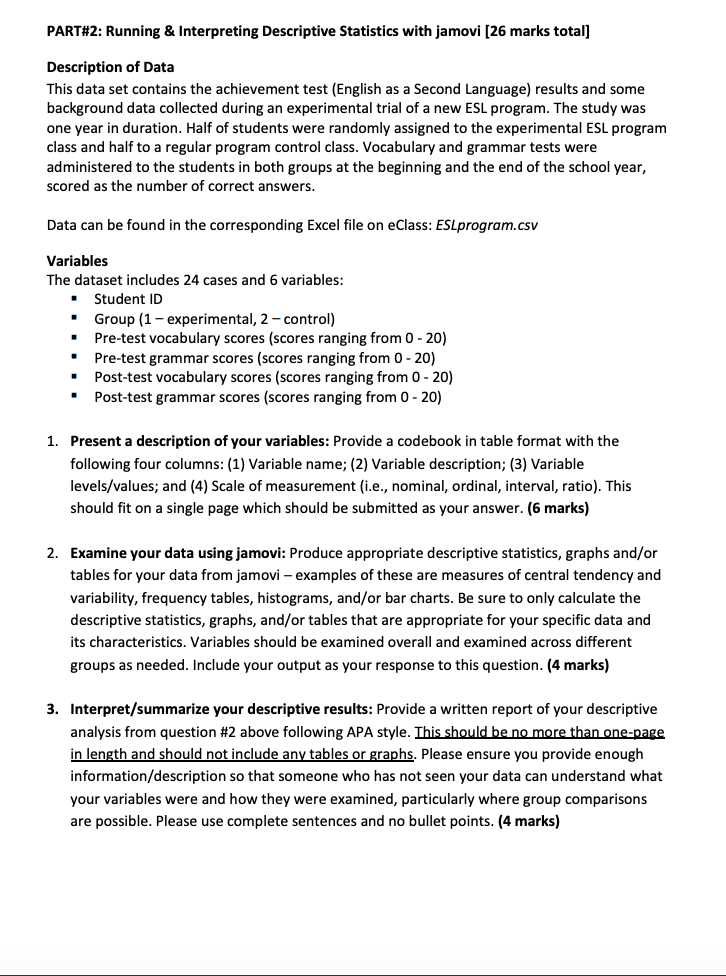
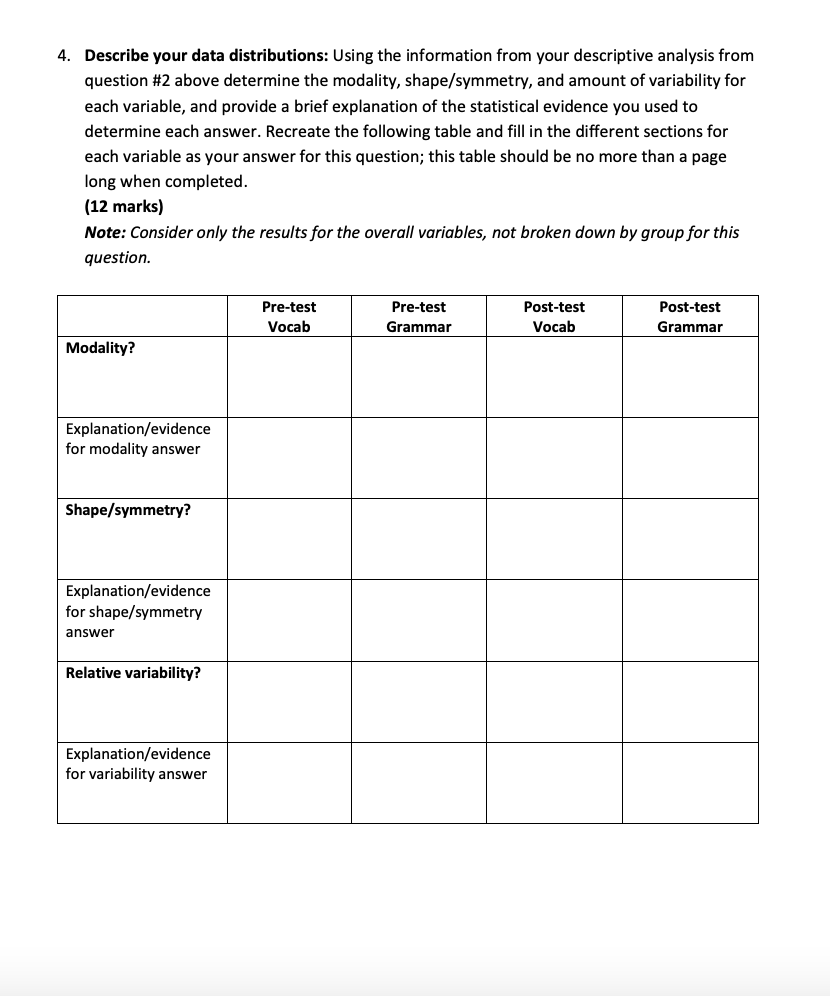
ESLProgram (5) Student ID Group PreVocab PreGrammar PostVocab PostGrammar 15 14 18 18 N 14 17 18 20 3 8 9 16 17 4 NO 13 14 19 18 11 12 19 19 6 14 13 20 18 N 10 12 13 14 8 NO 9 11 17 16 9 13 10 17 18 10 9 13 17 16 11 12 10 19 18 12 15 12 18 19 13 No 14 13 18 19 14 N 12 11 15 16 15 2 16 14 19 19 16 2 13 12 19 18 17 2 18 17 20 20 18 2 13 11 14 15 19 2 11 10 15 15 20 NO 11 12 16 16 21 14 13 18 19 22 10 8 17 17 23 12 11 19 19 24 2 13 12 18 17PART#2: Running & Interpreting Descriptive Statistics with jamovi [26 marks total] Description of Data This data set contains the achievement test (English as a Second Language) results and some background data collected during an experimental trial of a new ESL program. The study was one year in duration. Half of students were randomly assigned to the experimental ESL program class and half to a regular program control class. Vocabulary and grammar tests were administered to the students in both groups at the beginning and the end of the school year, scored as the number of correct answers. Data can be found in the corresponding Excel file on eClass: ESLprogram. csv Variables The dataset includes 24 cases and 6 variables: Student ID Group (1 - experimental, 2 - control) Pre-test vocabulary scores (scores ranging from 0 - 20) Pre-test grammar scores (scores ranging from 0 - 20) Post-test vocabulary scores (scores ranging from 0 - 20) Post-test grammar scores (scores ranging from 0 - 20) 1. Present a description of your variables: Provide a codebook in table format with the following four columns: (1) Variable name; (2) Variable description; (3) Variable levels/values; and (4) Scale of measurement (i.e., nominal, ordinal, interval, ratio). This should fit on a single page which should be submitted as your answer. (6 marks) 2. Examine your data using jamovi: Produce appropriate descriptive statistics, graphs and/or tables for your data from jamovi - examples of these are measures of central tendency and variability, frequency tables, histograms, and/or bar charts. Be sure to only calculate the descriptive statistics, graphs, and/or tables that are appropriate for your specific data and its characteristics. Variables should be examined overall and examined across different groups as needed. Include your output as your response to this question. (4 marks) 3. Interpret/summarize your descriptive results: Provide a written report of your descriptive analysis from question #2 above following APA style. This should be no more than one-page in length and should not include any tables or graphs. Please ensure you provide enough information/description so that someone who has not seen your data can understand what your variables were and how they were examined, particularly where group comparisons are possible. Please use complete sentences and no bullet points. (4 marks)4. Describe your data distributions: Using the information from your descriptive analysis from question #2 above determine the modality, shape/symmetry, and amount of variability for each variable, and provide a brief explanation of the statistical evidence you used to determine each answer. Recreate the following table and fill in the different sections for each variable as your answer for this question; this table should be no more than a page long when completed. (12 marks) Note: Consider only the results for the overall variables, not broken down by group for this question. Pre-test Pre-test Post-test Post-test Vocab Grammar Vocab Grammar Modality? Explanation/evidence for modality answer Shape/symmetry? Explanation/evidence for shape/symmetry answer Relative variability? Explanation/evidence for variability