

Answered step by step
Verified Expert Solution
Question
1 Approved Answer
Hi hi fellow experts, May I seek your guidance on the 2 questions (2nd & 3rd screenshots) posted with the 1st screenshot being the intro
Hi hi fellow experts,
May I seek your guidance on the 2 questions (2nd & 3rd screenshots) posted with the 1st screenshot being the intro to the question and the last screenshot being an appendix to the question for the 3rd screenshot. Thank you very much
Hi that would be thank you very much for your assistance.
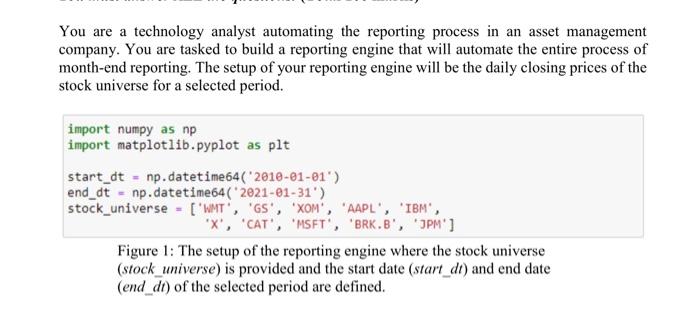
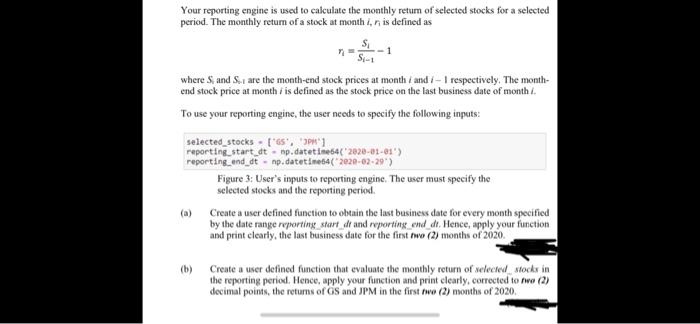
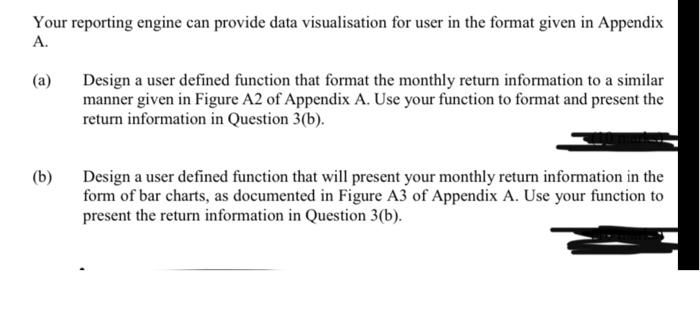
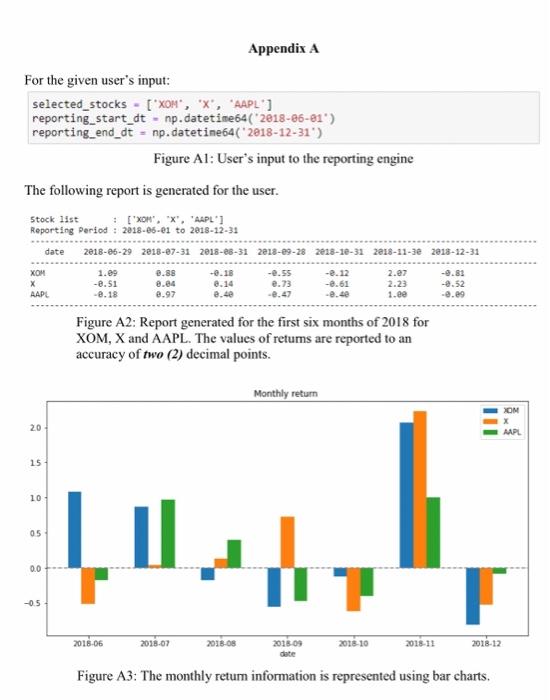
You are a technology analyst automating the reporting process in an asset management company. You are tasked to build a reporting engine that will automate the entire process of month-end reporting. The setup of your reporting engine will be the daily closing prices of the stock universe for a selected period. import numpy as np import matplotlib.pyplot as plt start_dt = np.datetime 64('2018-01-01) end_dt - np.datetime64('2021-01-31') stock_universe - ('WMT', 'GS', 'XOM', 'AAPL', IBM, 'X', 'CAT', 'MSFT', 'BRK.B', 'PM'] Figure 1: The setup of the reporting engine where the stock universe (stock_universe) is provided and the start date (start_dt) and end date (end_di) of the selected period are defined. Your reporting engine is used to calculate the monthly retum of selected stocks for a selected period. The monthly return of a stock at month in is defined as SI-1 where Sand S. are the month-end stock prices at month and 7- I respectively. The month- end stock price at monthi is defined as the stock price on the last business date of month / To use your reporting engine, the user needs to specify the following inputs: selected_stocks - [65', '1 reporting start dt . np.datetime642020-01-01) reporting and dt - np.datetime54(2020-02-29) Figure 3: User's inputs to reporting engine. The user must specify the selected stocks and the reporting period (a) Create a user defined function to obtain the last business date for every month specified by the date range reporting start dr and reporting end dt. Hence, apply your function and print clearly, the last business date for the first two (2) months of 2020. (b) Create a user defined function that evaluate the monthly return of selected stock in the reporting period. Hence, apply your function and print clearly, corrected to wo (2) decimal points, the returns of GS and JPM in the first wo (2) months of 2020 Your reporting engine can provide data visualisation for user in the format given in Appendix A. (a) Design a user defined function that format the monthly return information to a similar manner given in Figure A2 of Appendix A. Use your function to format and present the return information in Question 3(b). (b) Design a user defined function that will present your monthly return information in the form of bar charts, as documented in Figure A3 of Appendix A. Use your function to present the return information in Question 3(b). Appendix A For the given user's input: selected_stocks - [*XOM", "X', 'AAPL"] reporting_start_dt - np.datetime64(*2818-86-61") reporting_end_dt - np.datetime64('2018-12-31') Figure Al: User's input to the reporting engine The following report is generated for the user. : ["X', 'X', 'AAPL"] Stock list Reporting Period : 2018-06-01 to 2018-12-31 date 2018-06-29 2018-07-31 2018-08-31 2013-09-28 2018-12-31 2018-11-30 2018-12-31 XOM x AAPL 1.09 -0.51 -2.18 2.88 0.84 2.97 -2.55 2.73 8.14 8.40 -2.12 -2.61 -2.40 2.27 2.23 1.ee -0.83 -0.52 -2.e9 Figure A2: Report generated for the first six months of 2018 for XOM, X and AAPL. The values of retums are reported to an accuracy of two (2) decimal points. Monthly return XOM X AAPL 20 15 10 05 LI 0.0 -05 2018-06 2018-07 2018-08 2018-09 2018-10 2015-11 2018-12 Figure A3: The monthly retum information is represented using bar charts. You are a technology analyst automating the reporting process in an asset management company. You are tasked to build a reporting engine that will automate the entire process of month-end reporting. The setup of your reporting engine will be the daily closing prices of the stock universe for a selected period. import numpy as np import matplotlib.pyplot as plt start_dt = np.datetime 64('2018-01-01) end_dt - np.datetime64('2021-01-31') stock_universe - ('WMT', 'GS', 'XOM', 'AAPL', IBM, 'X', 'CAT', 'MSFT', 'BRK.B', 'PM'] Figure 1: The setup of the reporting engine where the stock universe (stock_universe) is provided and the start date (start_dt) and end date (end_di) of the selected period are defined. Your reporting engine is used to calculate the monthly retum of selected stocks for a selected period. The monthly return of a stock at month in is defined as SI-1 where Sand S. are the month-end stock prices at month and 7- I respectively. The month- end stock price at monthi is defined as the stock price on the last business date of month / To use your reporting engine, the user needs to specify the following inputs: selected_stocks - [65', '1 reporting start dt . np.datetime642020-01-01) reporting and dt - np.datetime54(2020-02-29) Figure 3: User's inputs to reporting engine. The user must specify the selected stocks and the reporting period (a) Create a user defined function to obtain the last business date for every month specified by the date range reporting start dr and reporting end dt. Hence, apply your function and print clearly, the last business date for the first two (2) months of 2020. (b) Create a user defined function that evaluate the monthly return of selected stock in the reporting period. Hence, apply your function and print clearly, corrected to wo (2) decimal points, the returns of GS and JPM in the first wo (2) months of 2020 Your reporting engine can provide data visualisation for user in the format given in Appendix A. (a) Design a user defined function that format the monthly return information to a similar manner given in Figure A2 of Appendix A. Use your function to format and present the return information in Question 3(b). (b) Design a user defined function that will present your monthly return information in the form of bar charts, as documented in Figure A3 of Appendix A. Use your function to present the return information in Question 3(b). Appendix A For the given user's input: selected_stocks - [*XOM", "X', 'AAPL"] reporting_start_dt - np.datetime64(*2818-86-61") reporting_end_dt - np.datetime64('2018-12-31') Figure Al: User's input to the reporting engine The following report is generated for the user. : ["X', 'X', 'AAPL"] Stock list Reporting Period : 2018-06-01 to 2018-12-31 date 2018-06-29 2018-07-31 2018-08-31 2013-09-28 2018-12-31 2018-11-30 2018-12-31 XOM x AAPL 1.09 -0.51 -2.18 2.88 0.84 2.97 -2.55 2.73 8.14 8.40 -2.12 -2.61 -2.40 2.27 2.23 1.ee -0.83 -0.52 -2.e9 Figure A2: Report generated for the first six months of 2018 for XOM, X and AAPL. The values of retums are reported to an accuracy of two (2) decimal points. Monthly return XOM X AAPL 20 15 10 05 LI 0.0 -05 2018-06 2018-07 2018-08 2018-09 2018-10 2015-11 2018-12 Figure A3: The monthly retum information is represented using bar charts The stock price is obtained through random
generation as follows:
np.random.seed(22)
selected_stocks = stock universe
num_days = int((end_dt - start_dt)p.timedelta64(1,'D'))
y = random.randint(10, 100, size = [num_days, len(selected_stocks)])
print(y)
Step by Step Solution
There are 3 Steps involved in it
Step: 1

Get Instant Access to Expert-Tailored Solutions
See step-by-step solutions with expert insights and AI powered tools for academic success
Step: 2

Step: 3
Ace Your Homework with AI
Get the answers you need in no time with our AI-driven, step-by-step assistance
Get Started
Mysql Examples Explanations Explain Examples
Authors: Harry Baker ,Ray Yao
1st Edition
B0CQK9RN2J, 979-8872176237