Answered step by step
Verified Expert Solution
Link Copied!

Question

1 Approved Answer

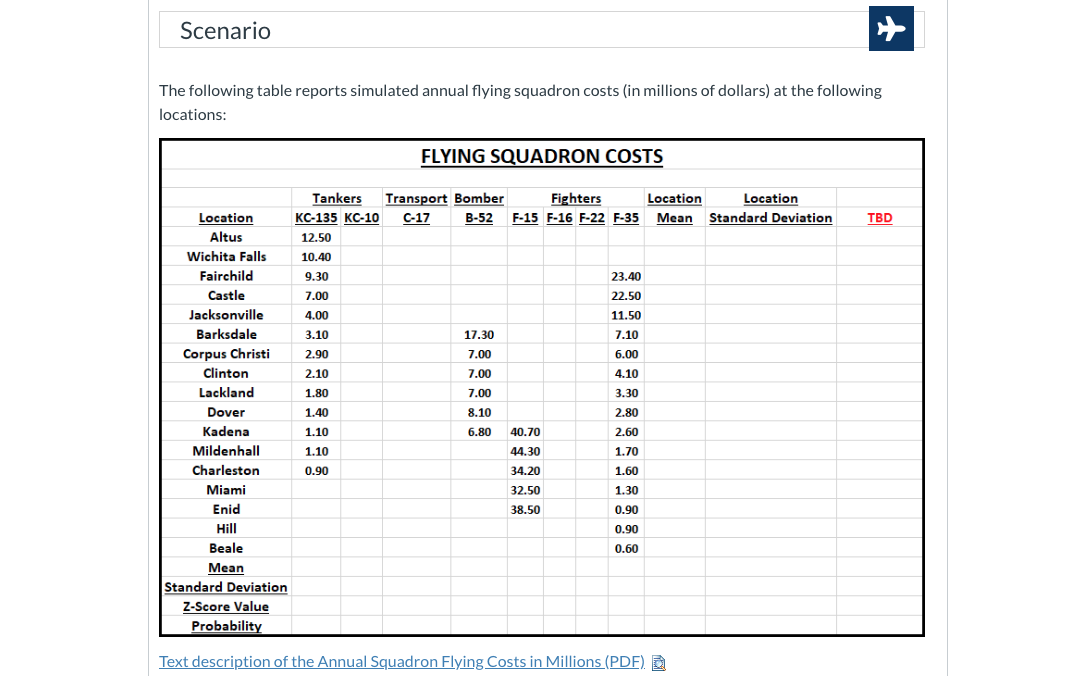
Hi, I need help answering this question. Please use the F-35 data Scenario The following table reports simulated annual flying squadron costs (in millions of

Hi, I need help answering this question. Please use the F-35 data

image text in transcribedimage text in transcribedimage text in transcribed
Scenario The following table reports simulated annual flying squadron costs (in millions of dollars) at the following locations: FLYING SQUADRON COSTS Tankers Transport Bomber Fighters Location Location Location KC-135 KC-10 C-17 B-52 F-15 F-16 F-22 F-35 Mean Standard Deviation TBD Altus 12.50 Wichita Falls 10.40 Fairchild 9.30 23.40 Castle 7.00 22.50 Jacksonville 4.00 11.50 Barksdale 3.10 17.30 7.10 Corpus Christi 2.90 7.00 6.00 Clinton 2.10 7.00 4.10 Lackland 1.80 7.00 3.30 Dover 1.40 8.10 2.80 Kadena 1.10 5.80 40.70 2.60 Mildenhall 1.10 44.30 1.70 Charleston 0.90 34.20 1.60 Miami 32.50 1.30 Enid 38.50 0.90 Hill 0.90 Beale 0.60 Mean Standard Deviation Z-Score Value Probability Text description of the Annual Squadron Flying Costs in Millions (PDF). DComplete X Use Microsoft Excel and StatDisk to complete the Flying Squadron Costs table for the aircraft type listed below: . If your last name begins with the letter A through L, complete the costs using the B-52 data; use the Kadena data point in your z-score and probability calculations. . If your last name begins with the letter M through Z, complete the costs using the F-35 data; use the Charleston data point in your z-score and probability calculations. Report your values to two decimal places (i.e., 0.12) except for probability. Report probability values to four decimal places (i.e. p = 0.1234). Your StatDisk results should look similar to this image: A Statdisk File Edit Analysis Data Data Sets Window Help A Statdisk Sample Editor Clear Copy Paste Save Print Data Tools ROW 1 NC 135 A Explore Data - Descriptive Statistics 12.3 10 4 which column of data would you like to explore? 1 KC 135 9.3 Explore Data - Column Sample Size, n: Hislogram of Column 1 Hean: 4. 430769 2.9 Midrange 6.7 5. 862265 variance, SA?! Standard Deviation, gi Mean Absolute Deviation: 3. Range: 116 Coefficient of variance: 90.17 Minimum: 2:9 Maximumy x Values 12.5 Sun of Squares ; $7.6 Boxplot of Column 1 446- 76 95% CI for the Mean: 2. 0164

Step by Step Solution

There are 3 Steps involved in it

Step: 1

blur-text-image

Get Instant Access to Expert-Tailored Solutions

See step-by-step solutions with expert insights and AI powered tools for academic success

Step: 2

blur-text-image

Step: 3

blur-text-image

Ace Your Homework with AI

Get the answers you need in no time with our AI-driven, step-by-step assistance

Get Started

Recommended Textbook for

Linear Algebra A Modern Introduction

Authors: David Poole

3rd edition

9781133169574 , 978-0538735452

More Books

Students also viewed these Mathematics questions

Question

To find integral of sin(logx) .

Answered: 1 week ago