

Question
Hi, I need help creating these charts and tables: frequency chart, histogram, descriptive statistic table, measurement scale, measure of central tendency, and an evaluation of
Hi, I need help creating these charts and tables: frequency chart, histogram, descriptive statistic table, measurement scale, measure of central tendency, and an evaluation of what all data shows.
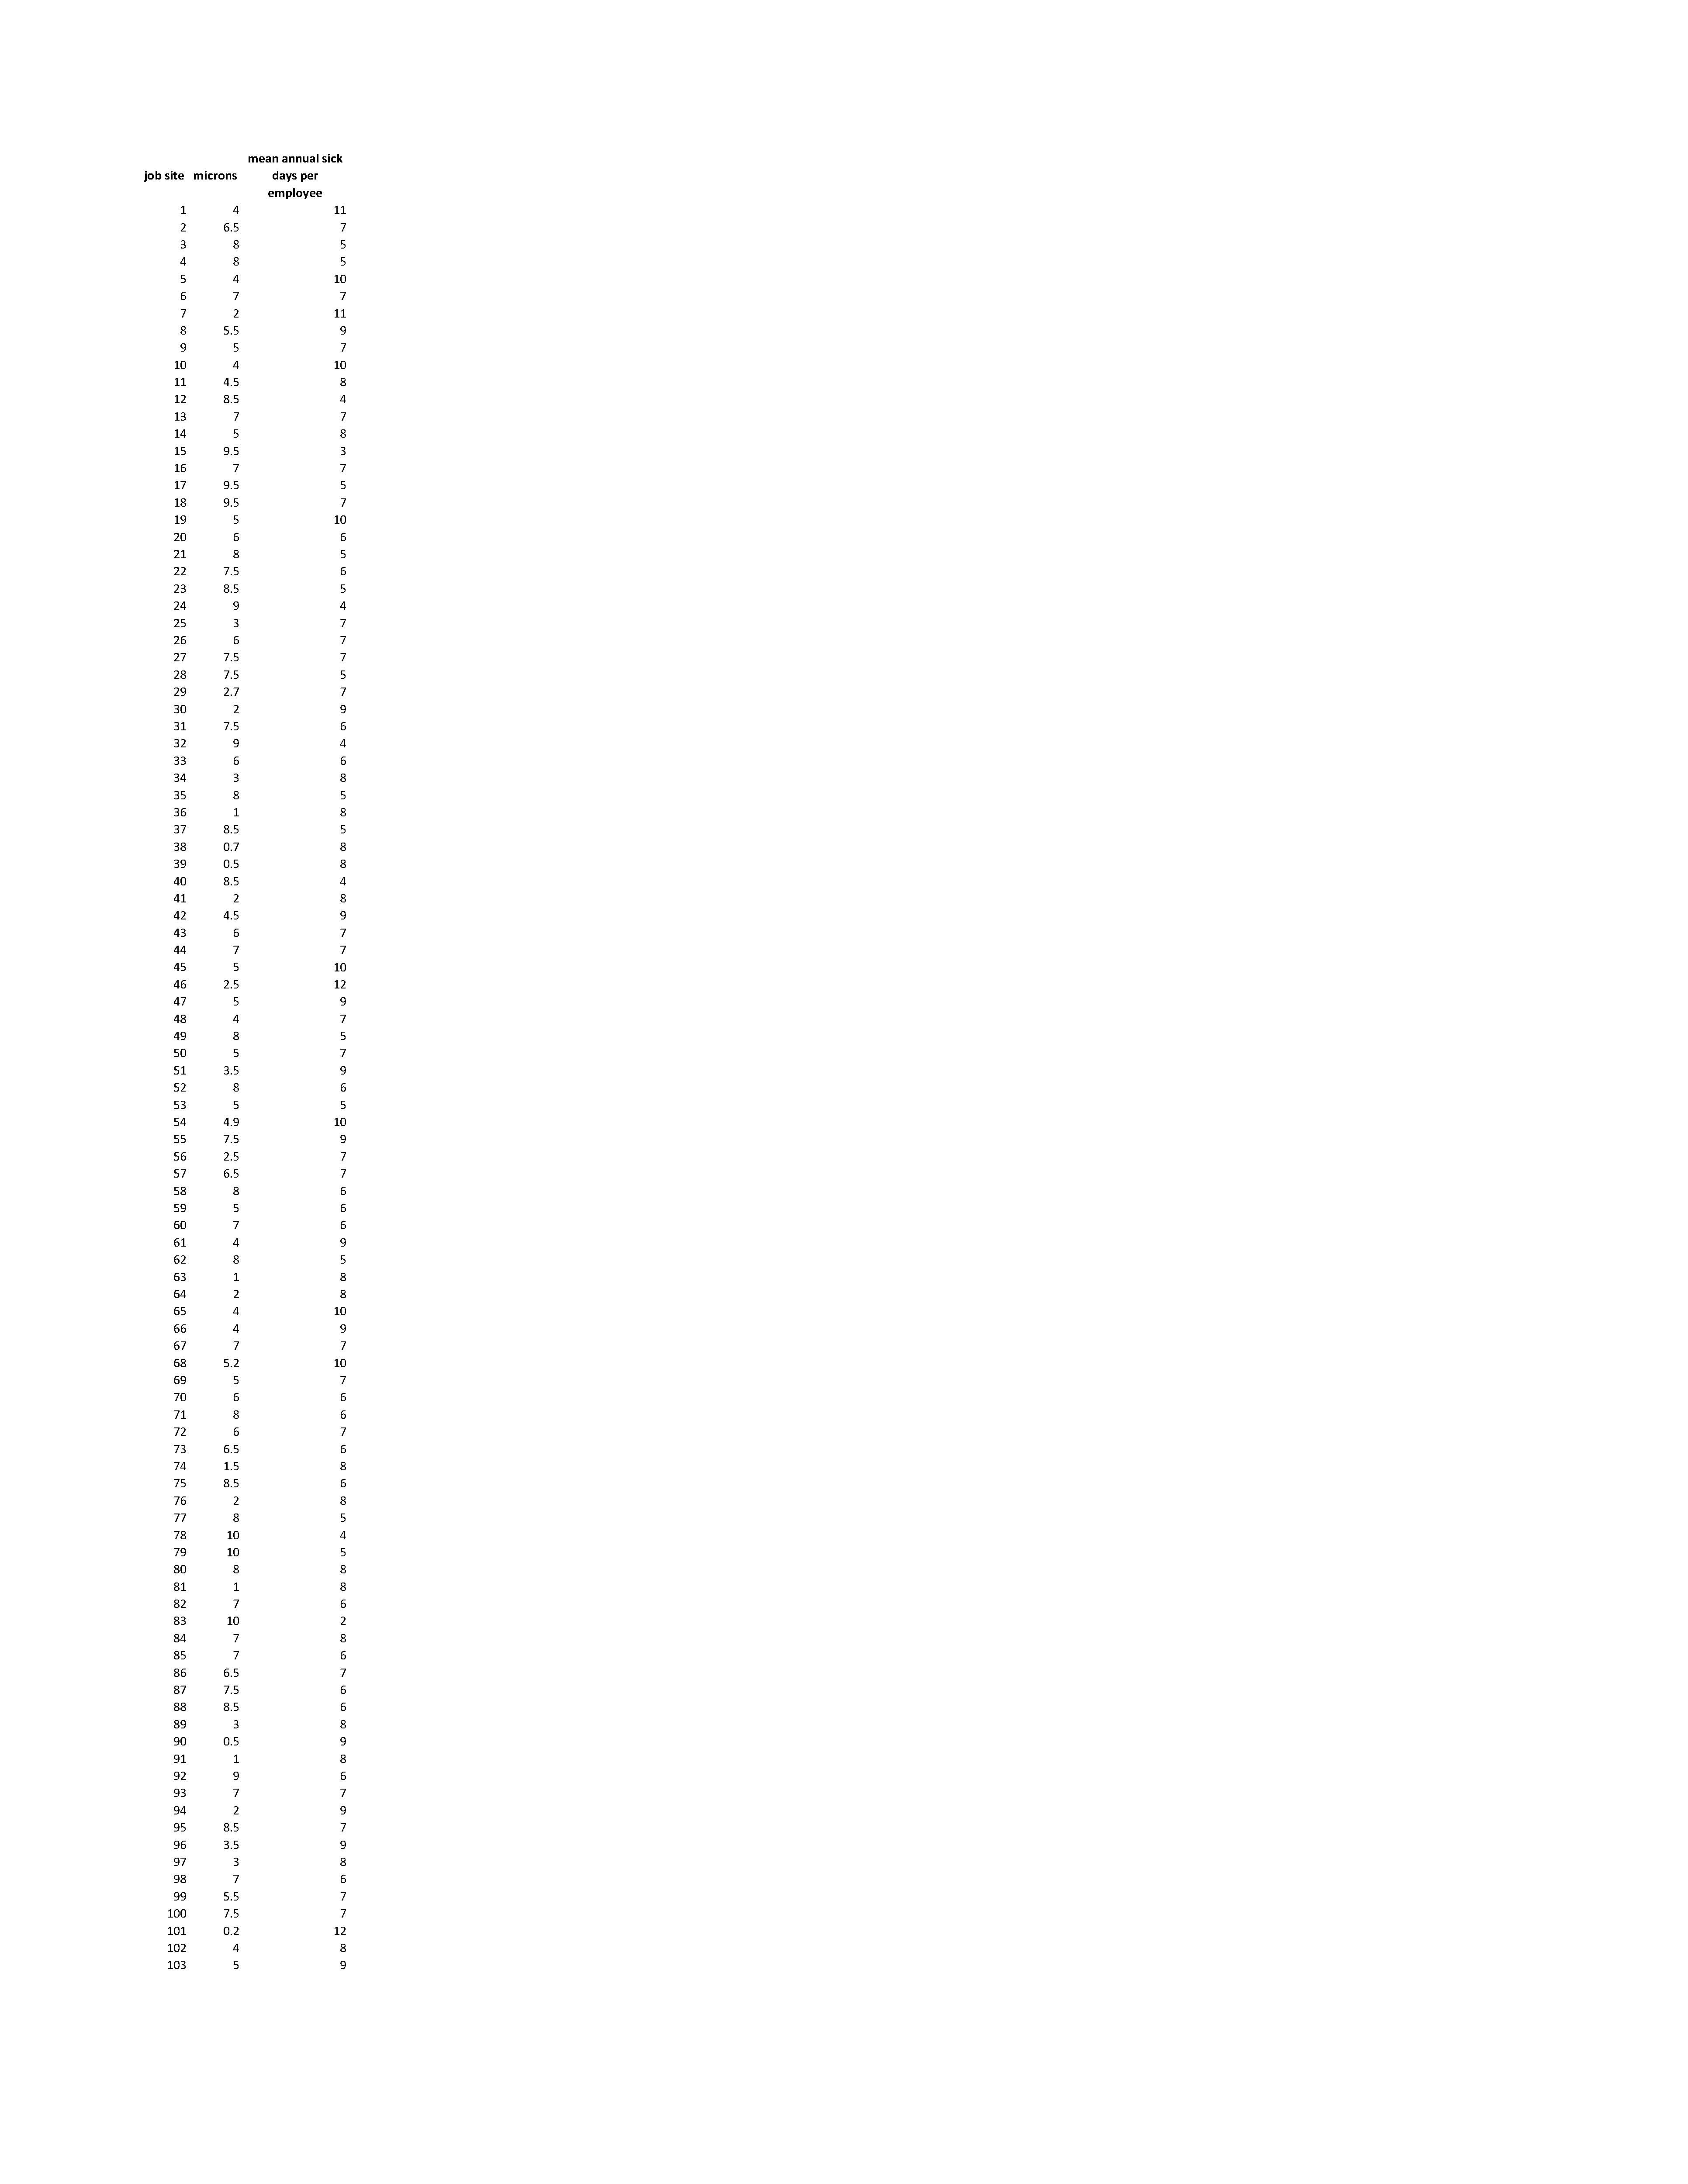
It would be helpful to understand if there is a relationship between PM size and employee health. Air quality data have been collected from 103 job sites, which is reflected in PM size. Data is also available for average annual sick days per employee per job-site.
Step by Step Solution
There are 3 Steps involved in it
Step: 1

Get Instant Access to Expert-Tailored Solutions
See step-by-step solutions with expert insights and AI powered tools for academic success
Step: 2

Step: 3
Ace Your Homework with AI
Get the answers you need in no time with our AI-driven, step-by-step assistance
Get Started
Mathematical Interest Theory
Authors: Leslie Jane, James Daniel, Federer Vaaler
3rd Edition
147046568X, 978-1470465681