

Question
Hi, I need help with creating a plot for my Python program. I am writing a program finding best plane ticket, and I would like
Hi,
I need help with creating a plot for my Python program.
I am writing a program finding best plane ticket, and I would like to add plot to my printed results.
I want it to be a plot with y being prices from 'Price' data frame column, and bars to be average and minimum price to compare. Bars maybe?
I have two data frames for round trip, so I want it to be two plots!
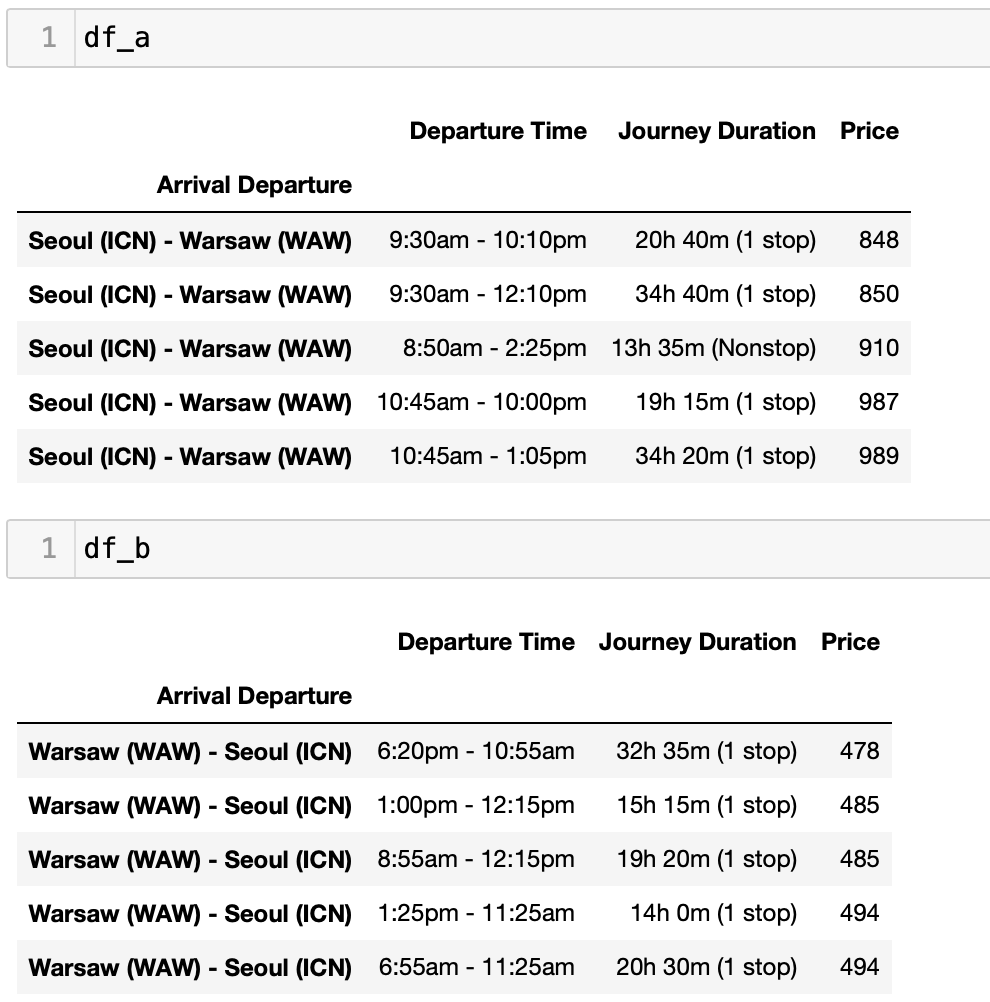
My data frames:
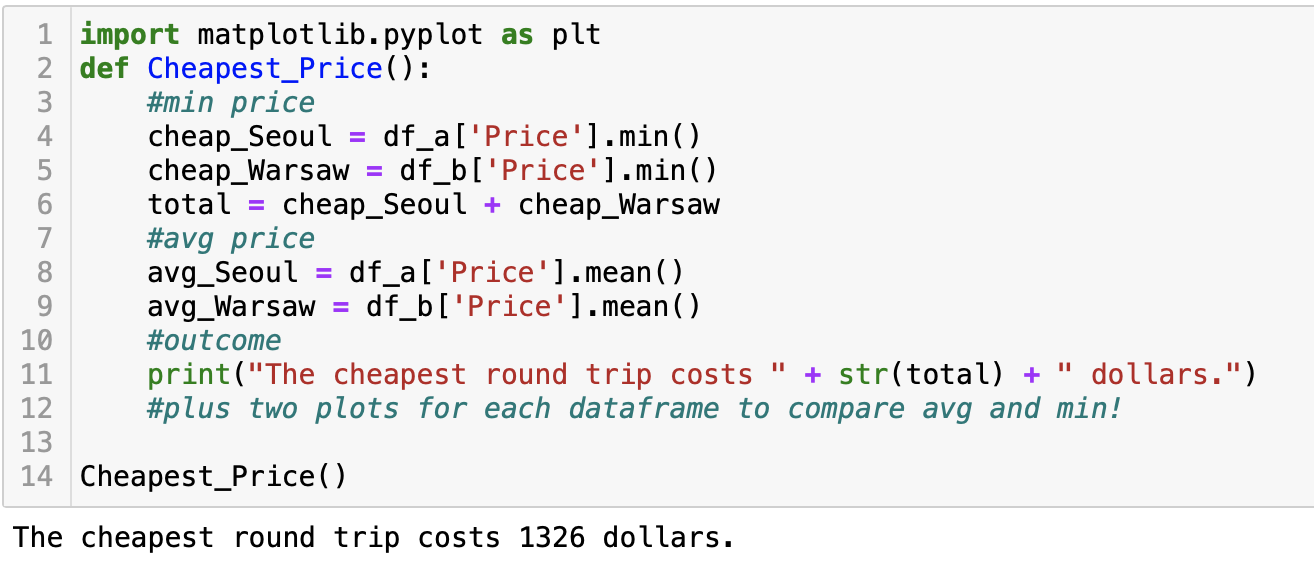
And my code now:
I would appreciate also making my code more clean and eye pleasing! :)
TIA!
Departure Time Journey Duration Price Arrival Departure \begin{tabular}{lrrrr} \hline Seoul (ICN) - Warsaw (WAW) & 9:30am10:10pm & 20h 40m (1 stop) & 848 \\ & & & & \\ Seoul (ICN) - Warsaw (WAW) & 9:30am12:10pm & 34h40m (1 stop) & 850 \\ & & & & \\ Seoul (ICN) - Warsaw (WAW) & 8:50am2:25pm & 13h35m (Nonstop) & 910 \\ & & & & \\ Seoul (ICN) - Warsaw (WAW) & 10:45am10:00pm & 19h15m (1 stop) & 987 \\ & & & 34h20m (1 stop) & 989 \end{tabular} Departure Time Journey Duration Price Arrival Departure \begin{tabular}{llll} \hline Warsaw (WAW) - Seoul (ICN) & 6:20pm10:55am & 32h 35m (1 stop) & 478 \\ Warsaw (WAW) - Seoul (ICN) & 1:00pm12:15pm & 15h15m (1 stop) & 485 \\ Warsaw (WAW) - Seoul (ICN) & 8:55am12:15pm & 19h20m (1 stop) & 485 \\ Warsaw (WAW) - Seoul (ICN) & 1:25pm11:25am & 14h0m (1 stop) & 494 \\ Warsaw (WAW) - Seoul (ICN) & 6:55am11:25am & 20h 30m (1 stop) & 494 \end{tabular} \begin{tabular}{r|l} 1 & import matplotlib.pyplot as plt \\ 2 & def Cheapest_Price(): \\ 3 & \#min price \\ 4 & cheap_Seoul = df_a['Price'] .min() \\ 5 & cheap_Warsaw = df_b['Price'].min() \\ 6 & total = cheap_Seoul + cheap_Warsaw \\ 7 & \#avg price \\ 8 & avg_Seoul =dfa[ 'Price'] .mean() \\ 9 & avg_Warsaw =df b['Price'].mean() \\ 10 & \#outcome \\ 11 & print("The cheapest round trip costs " + str(total) + " dollars.") \\ 12 & \#plus two plots for each dataframe to compare avg and min! \\ 13 & \\ 14 & Cheapest_Price() \end{tabular} The cheapest round trip costs 1326 dollars
Step by Step Solution
There are 3 Steps involved in it
Step: 1

Get Instant Access to Expert-Tailored Solutions
See step-by-step solutions with expert insights and AI powered tools for academic success
Step: 2

Step: 3
Ace Your Homework with AI
Get the answers you need in no time with our AI-driven, step-by-step assistance
Get Started
Logistics Lifeline Supply Chain Strategies
Authors: Ehsan Sheroy
1st Edition
7419377502, 978-7419377503